CRISC · Domain 3 · 32% of the exam Risk Response and Reporting
28 topics · Risk response · Ownership and accountability · Third-party risk · Issues and exceptions · Control design · Control testing · Risk data and treatment plans · Monitoring and metrics · Reporting · Emerging risk
D3 Risk response Risk Response Options: Accept, Mitigate, Transfer, Avoid
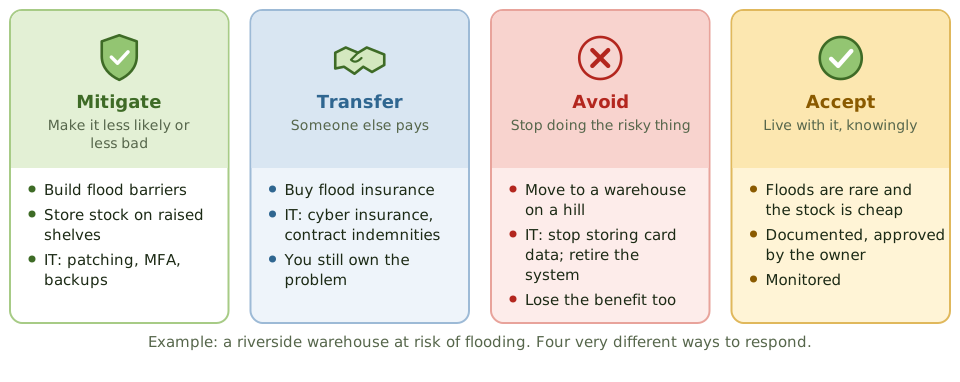
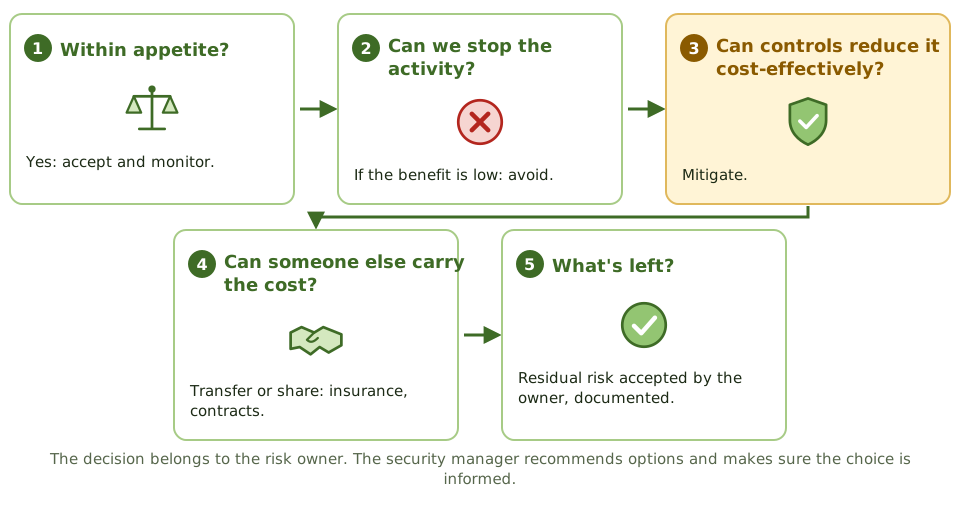
The four ways to respond to IT risk, when each fits, and why the risk owner chooses the response after the risk practitioner sets out the options.
When each fits
| Response | Fits when… |
|---|
| Accept | Risk is within appetite, or treatment costs more than it saves |
| Mitigate | Controls reduce risk cost-effectively |
| Transfer | Financial impact can be shared through insurance or contracts |
| Avoid | The activity's benefit doesn't justify its risk |
ExampleA retailer facing payment card breach risk uses a hosted payment page (avoids storing card data), keeps cyber insurance (transfers some cost) and accepts the small residual risk on its own website.
Who decides
- 1The practitioner sets out options, costs and residual risk.
- 2The risk owner chooses within their authority.
- 3Higher risks escalate to more senior owners.
- 4The decision is recorded in the register.
How the exam asks about it
| If the question asks… | The answer is usually… |
|---|
| Who selects the risk response | The risk owner |
| Buying cyber insurance | Transfer; accountability stays |
| Stopping a risky service | Avoidance |
| Risk within appetite | Accept and monitor |
Key takeaways
- ✓The four responses are accept, mitigate (reduce), transfer (share) and avoid.
- ✓The risk owner chooses the response; the practitioner presents options with costs and residual risk.
- ✓Acceptance must be informed, documented and within the owner's authority.
- ✓Transfer shares financial impact but never accountability.
- ✓Avoidance removes the activity, and its benefits, entirely.
- ✓Responses are often combined; residual risk must end up within appetite.
Exam traps
- !Treating mitigation as the only option.
- !Thinking insurance transfers accountability or reputational damage.
- !Accepting a risk by default because nobody decided.
- !The practitioner choosing the response instead of the owner.
Risk response Aligning Responses with Appetite and Tolerance
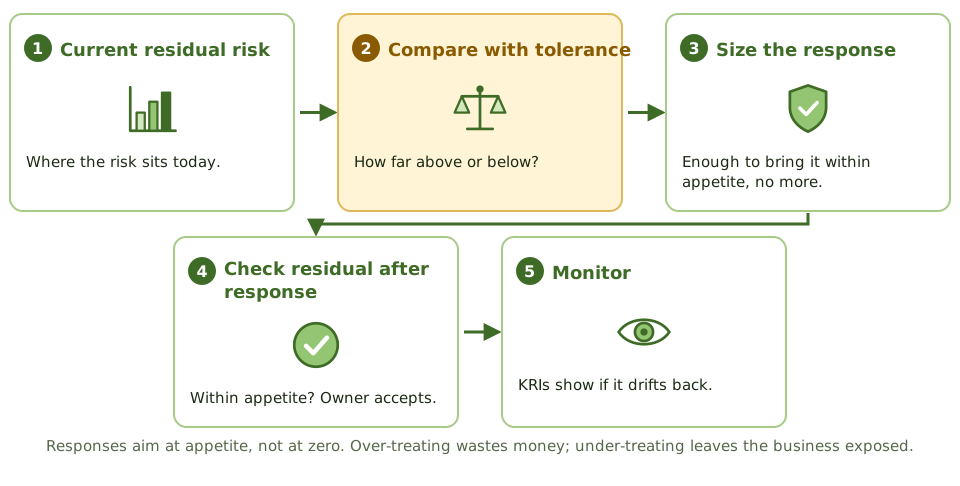
How to size a risk response so that residual risk lands within appetite and tolerance, avoiding both over-treatment that wastes resources and under-treatment that leaves the business exposed.
Aim for appetite, not zero
The goal of a response is residual risk within appetite. Spending more than that buys little extra value; spending less leaves the business carrying more risk than the board agreed to.
Over- and under-treating
Over-treatingCosts exceed benefit; controls add friction and get bypassed.
Under-treatingResidual risk stays above appetite; losses exceed what the board accepted.
ExampleA low-risk internal wiki was put behind the same MFA, VPN and monitoring as the payment system. Staff started copying content to personal notes to avoid the hassle, creating a new risk. Scaling controls to the wiki's actual risk fixed it.
Different appetites
| Risk type | Typical appetite |
|---|
| Customer data breach | Low |
| Safety of operational systems | Very low |
| Trying new technology in pilots | Moderate |
| Minor internal service outages | Moderate |
How the exam asks about it
| If the question asks… | The answer is usually… |
|---|
| Goal of a risk response | Residual risk within appetite |
| Residual still above appetite | Further response or escalation |
| After implementing a response | Re-assess residual risk |
| Most expensive control option | Not best unless needed to reach appetite |
Key takeaways
- ✓Responses aim to bring residual risk within appetite, not to eliminate risk.
- ✓Over-treating wastes money and can slow the business; under-treating leaves risk above appetite.
- ✓Check residual risk after the response, not just whether a control was added.
- ✓If residual risk stays above appetite, respond further or escalate for formal acceptance.
- ✓Appetite can differ by risk type; a low appetite for safety risk can sit alongside a higher one for innovation risk.
Exam traps
- !Choosing the response that removes the most risk regardless of appetite or cost.
- !Closing a risk once a control is added without re-rating residual risk.
- !Applying one appetite level to every type of risk.
- !Leaving risks above appetite without escalation.
Risk response Cost-Benefit Analysis of Risk Responses
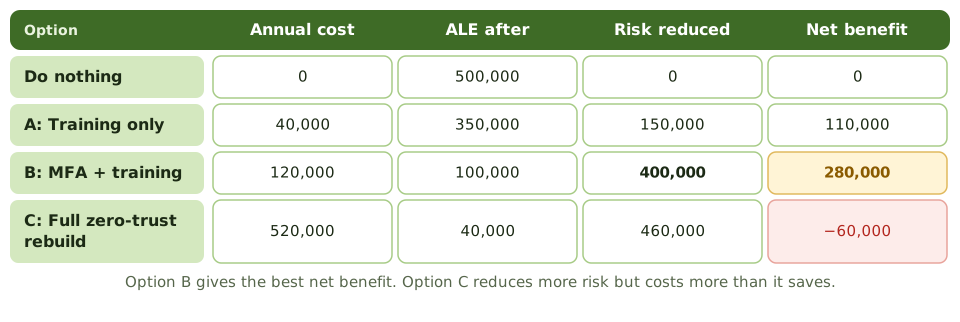
How to compare response options by their full cost and the risk they remove, including doing nothing, and when non-financial factors override the numbers.
Total cost of a response
- 1Purchase and licences.
- 2Implementation and integration.
- 3Staff time to operate and maintain.
- 4Training and support.
- 5Business friction and lost productivity.
When numbers aren't enough
Legal requirementsSome controls are mandatory whatever the cost-benefit.
SafetyHarm to people outweighs financial calculations.
Reputation and trustHard to quantify but real.
ExampleEncryption of a small patient database didn't pass a pure ALE test, but the regulator required it. The decision was recorded as a compliance requirement, not a cost-benefit choice.
How the exam asks about it
| If the question asks… | The answer is usually… |
|---|
| BEST basis for choosing between controls | Risk reduction relative to total cost |
| Cost most often missed | Ongoing staff time and operation |
| Option every business case should include | Do nothing, with its residual risk |
| Control fails cost-benefit but is legally required | Implement it; compliance overrides |
Key takeaways
- ✓Compare each option's total annual cost with the risk reduction it delivers.
- ✓Include a 'do nothing' option so decision-makers can see the residual risk of not acting.
- ✓Total cost includes purchase, implementation, staff time, maintenance and business friction.
- ✓The best option is usually the one with the greatest net benefit that brings risk within appetite.
- ✓Legal requirements, safety and reputation can justify controls the numbers alone don't support.
Exam traps
- !Comparing control cost with total ALE instead of the reduction in ALE.
- !Leaving out staff time and ongoing operating costs.
- !Choosing the option that removes most risk even when it costs more than it saves.
- !Ignoring legal or safety requirements because the numbers are unfavourable.
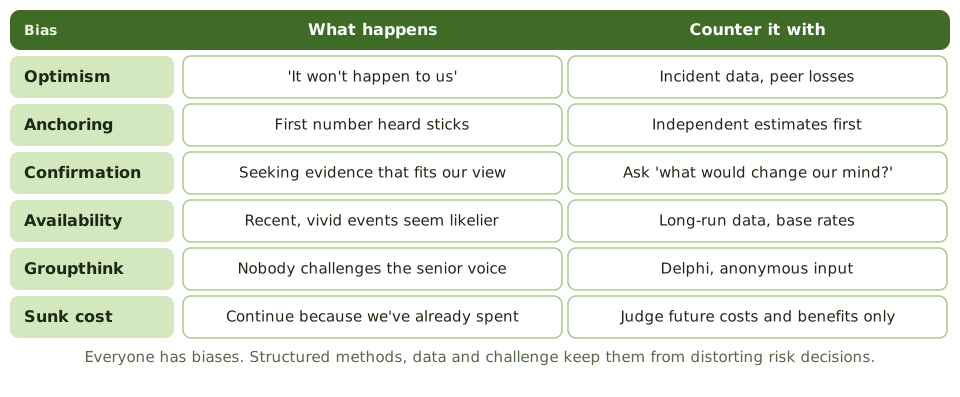
Risk response Bias in Risk Decisions and Reporting
The cognitive biases that distort risk estimates, responses and reports, and the structured methods a risk practitioner uses to keep decisions objective.
Where bias creeps in
| Stage | How bias shows up |
|---|
| Estimating | Optimistic likelihoods; anchored on first number |
| Choosing responses | Favouring familiar controls; sunk cost |
| Reporting | Selective data; softened wording; misleading scales |
Countering bias
- 1Collect independent estimates before discussion.
- 2Use incident and industry data as a check.
- 3Ask what evidence would change the conclusion.
- 4Invite challenge from people outside the team.
- 5Show the same scales and periods in every report.
ExampleIn a workshop, the CIO said ransomware was 'very unlikely here', and nobody disagreed. A follow-up anonymous estimate showed most participants rated it likely. The scenario was re-rated and treated.
How the exam asks about it
| If the question asks… | The answer is usually… |
|---|
| Reduce groupthink in estimates | Anonymous methods such as Delphi |
| Project continues because of money spent | Sunk cost bias; judge future value |
| BEST check on optimistic estimates | Incident and industry data |
| Report hides an unfavourable trend | Present complete, consistent data |
Key takeaways
- ✓Common biases include optimism, anchoring, confirmation, availability, groupthink and sunk cost.
- ✓Bias affects estimates, the choice of response and how risk is reported.
- ✓Structured methods, data and independent challenge reduce bias.
- ✓Anonymous estimation such as Delphi reduces anchoring and groupthink.
- ✓Reports can be biased by selective data, misleading scales or softened wording.
Exam traps
- !Assuming experienced people aren't biased.
- !Letting the most senior person speak first in estimation workshops.
- !Continuing a project because of money already spent.
- !Rating a risk higher simply because a similar incident was in the news.
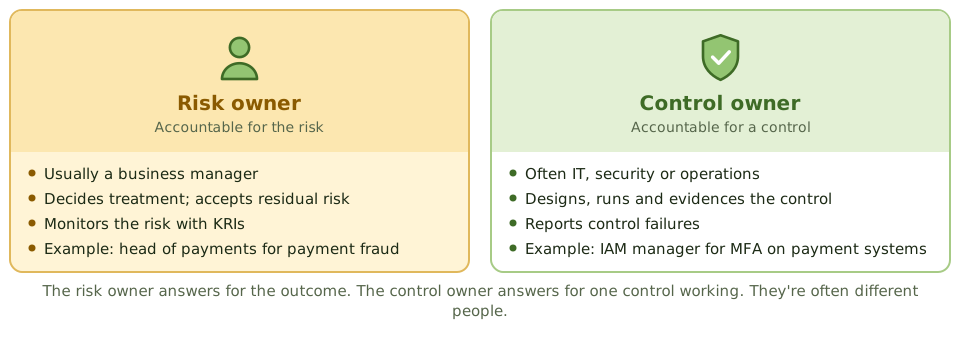
Ownership and accountability Risk Owners and Control Owners
The difference between owning a risk and owning a control, why they're often different people, and how the two work together to keep risk within appetite.
Many-to-many
| Risk (owner) | Controls (owners) |
|---|
| Payment fraud (CFO) | Dual approval (finance), MFA (IAM team), monitoring (SOC) |
| Customer data breach (head of sales) | Encryption (infrastructure), DLP (security), access reviews (sales managers) |
Working together
- 1 Control owner detects failure
- 2 Reports to risk owner
- 3 Practitioner reassesses risk
- 4 Risk owner decides response
ExampleQuarterly access reviews for the payments system were skipped twice. The IAM team (control owner) told the CFO (risk owner), the practitioner re-rated fraud risk from medium to high, and the CFO approved temporary extra monitoring.
How the exam asks about it
| If the question asks… | The answer is usually… |
|---|
| Who is accountable for a control operating | The control owner |
| Who decides when a control fails | The risk owner |
| Can one person be both | Yes, but often they're different |
| BEST way to clarify ownership | Map risks to controls and named owners |
Key takeaways
- ✓The risk owner is accountable for the risk outcome; the control owner is accountable for a control operating effectively.
- ✓Risk owners are usually business managers; control owners are often in IT, security or operations.
- ✓One risk may rely on several controls with different owners; one control may support several risks.
- ✓Control owners report control failures to risk owners, who decide on the response.
- ✓Mapping risks to controls and owners shows who must act when something changes.
Exam traps
- !Assuming the control owner also owns the risk.
- !Making IT the risk owner because IT runs the controls.
- !Control failures reported only within IT, never reaching the risk owner.
- !Controls with no named owner.
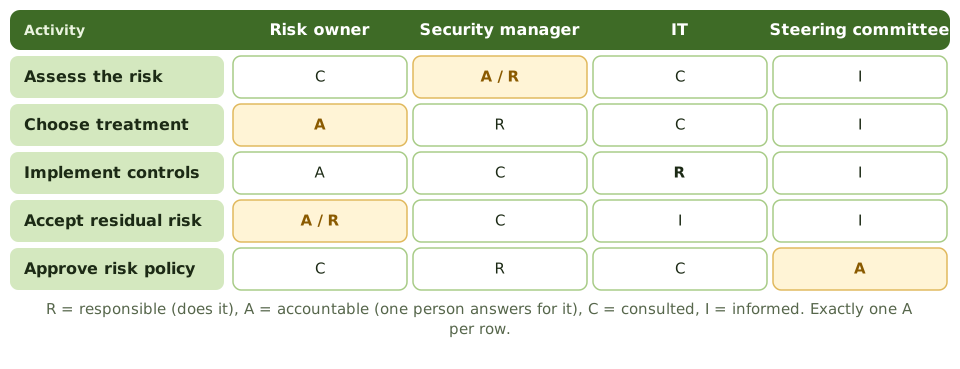
Ownership and accountability RACI and Escalation
How a RACI chart makes responsibilities for risk activities clear, and how agreed escalation paths and thresholds move risks to the right decision-makers in time.
The four letters
| Letter | Meaning |
|---|
| R | Responsible: does the work |
| A | Accountable: answers for the result (exactly one) |
| C | Consulted: gives input before |
| I | Informed: told after |
Escalation paths
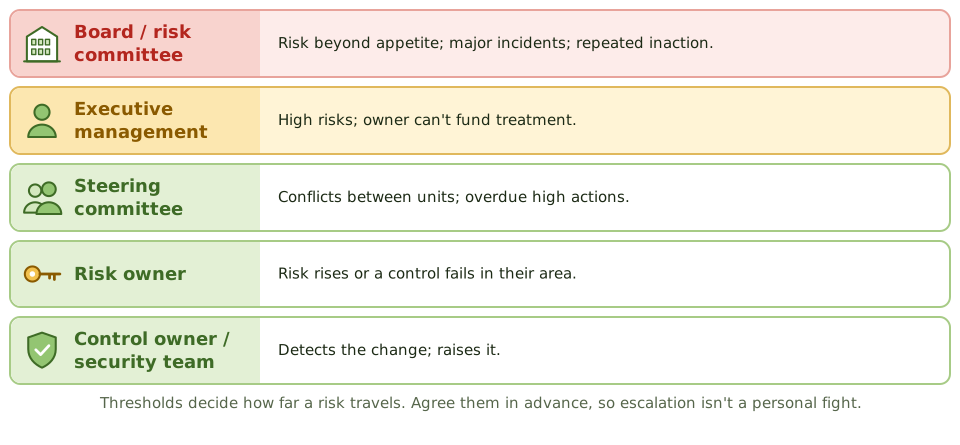
ExampleA KRI for unpatched critical servers turns red. The agreed path sends it to the risk owner the same day and to the steering committee if not recovered in 30 days. When it wasn't, the committee approved an emergency patch window.
How the exam asks about it
| If the question asks… | The answer is usually… |
|---|
| How many Accountable per activity | Exactly one |
| Purpose of a RACI | Clarify roles and avoid gaps or overlaps |
| What triggers escalation | Agreed thresholds |
| Owner ignores an overdue high risk | Escalate through the agreed path |
Key takeaways
- ✓RACI shows who is Responsible, Accountable, Consulted and Informed for each activity.
- ✓Each activity has exactly one Accountable person.
- ✓Escalation paths define how far a risk travels based on agreed thresholds.
- ✓Escalation should be triggered by thresholds agreed in advance, not personal judgement alone.
- ✓Escalation is part of normal governance, not a sign of failure.
Exam traps
- !Two Accountable people for one activity.
- !Escalating directly to the board, skipping the risk owner.
- !Not escalating because it might upset the owner.
- !Escalation paths with no thresholds.
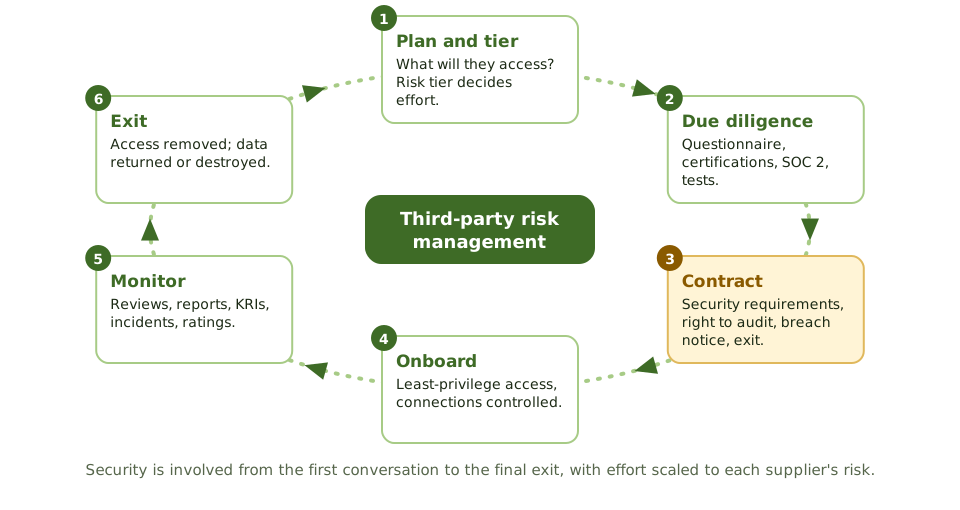
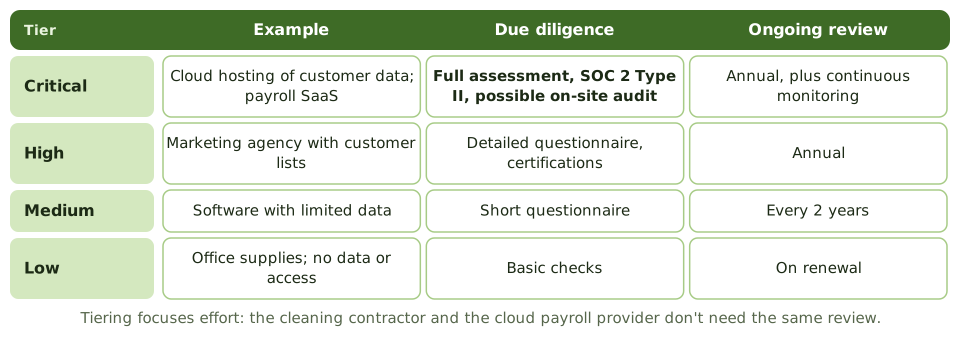
Third-party risk Third-Party Risk Governance and Due Diligence
How the organisation governs the risk of suppliers and outsourcing through the third-party life cycle, tiering by risk and due diligence before contracts are signed.
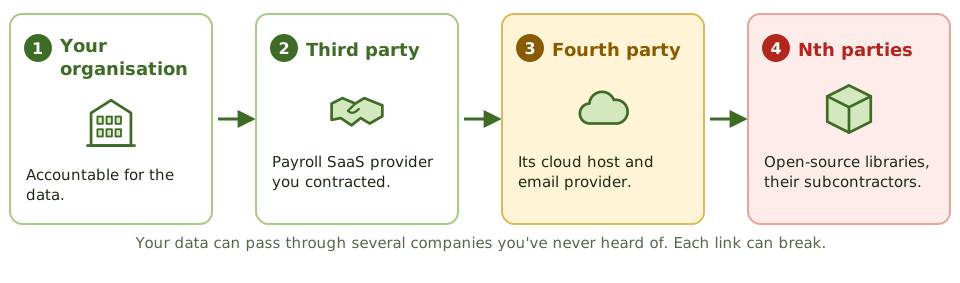
The third-party life cycle
Due diligence
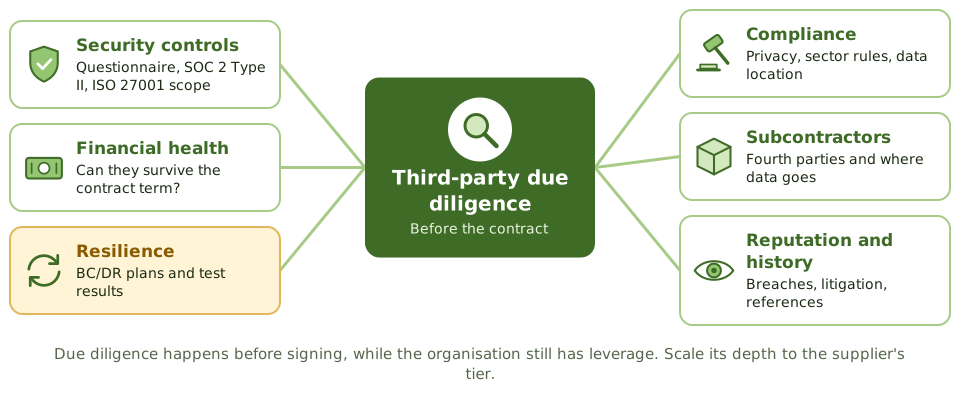
ExampleDue diligence on a payroll SaaS provider found its SOC 2 report covered only its US data centre, while the organisation's data would sit in Europe. The contract was made conditional on a European assurance report.
How the exam asks about it
| If the question asks… | The answer is usually… |
|---|
| When to assess a supplier's security | Before signing the contract |
| BEST way to manage many suppliers | Tier by risk and scale effort |
| Who is accountable for outsourced data | The organisation |
| Supplier presents an ISO 27001 certificate | Check the scope covers the service |
Key takeaways
- ✓Third-party risk management covers suppliers from planning through due diligence, contract, onboarding, monitoring and exit.
- ✓Outsourcing transfers activities, not accountability.
- ✓Tier suppliers by risk so that due diligence effort matches what they can affect.
- ✓Due diligence happens before signing and covers security, finances, resilience, compliance and subcontractors.
- ✓Fourth parties (suppliers' suppliers) are part of the risk.
Exam traps
- !Assessing suppliers only after the contract is signed.
- !Giving every supplier the same level of review.
- !Relying on a certificate without checking its scope.
- !Believing outsourcing moves accountability to the supplier.
Third-party risk Contracts, SLAs and the Right to Audit
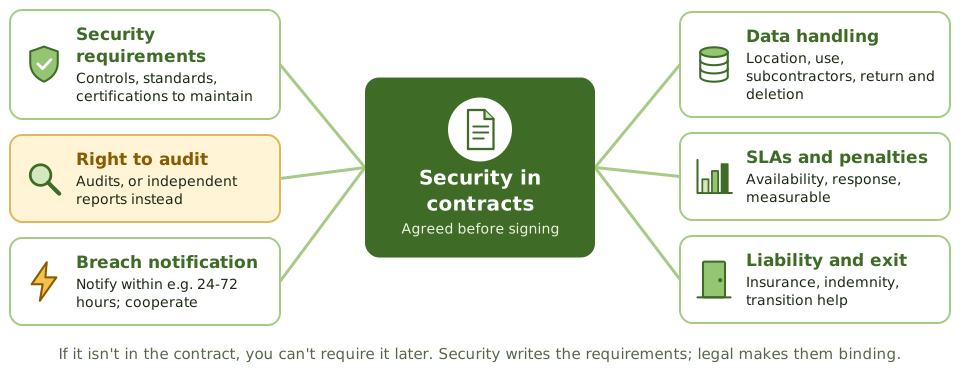
How contracts and service level agreements turn risk requirements into enforceable obligations, and which clauses matter most for managing third-party IT risk.
Good and bad SLAs
| Weak | Strong |
|---|
| High availability | 99.9% monthly, measured end to end |
| Prompt incident response | Severity 1 response within 30 minutes |
| Timely breach notice | Notify within 24 hours of discovery |
Right to audit
Without a right to audit, or at least to receive independent assurance reports such as SOC 2 Type II, the organisation can't verify that the supplier's controls work. Large providers often offer reports instead of on-site audits; check that their scope covers the services used.
ExampleAfter a supplier breach, a retailer found its contract had no breach notification clause. The supplier told customers three weeks later. New contracts now require notice within 24 hours and cooperation with investigations.
How the exam asks about it
| If the question asks… | The answer is usually… |
|---|
| MOST important clause for oversight | Right to audit or receive assurance reports |
| Characteristic of a good SLA | Specific, measurable, monitored |
| When to define security requirements | Before the contract is signed |
| Provider refuses on-site audits | Accept independent assurance reports of relevant scope |
Key takeaways
- ✓If a requirement isn't in the contract, it usually can't be enforced later.
- ✓Key clauses cover security requirements, right to audit, breach notification, data handling, SLAs, liability and exit.
- ✓A right to audit, or to receive independent assurance reports, is essential for ongoing oversight.
- ✓SLAs must be specific and measurable, with consequences for breaches.
- ✓The risk practitioner defines requirements; legal makes them binding.
Exam traps
- !Vague SLAs such as 'high availability'.
- !Signing standard supplier terms with no right to audit.
- !Missing breach notification timelines.
- !No clause on returning or deleting data at exit.
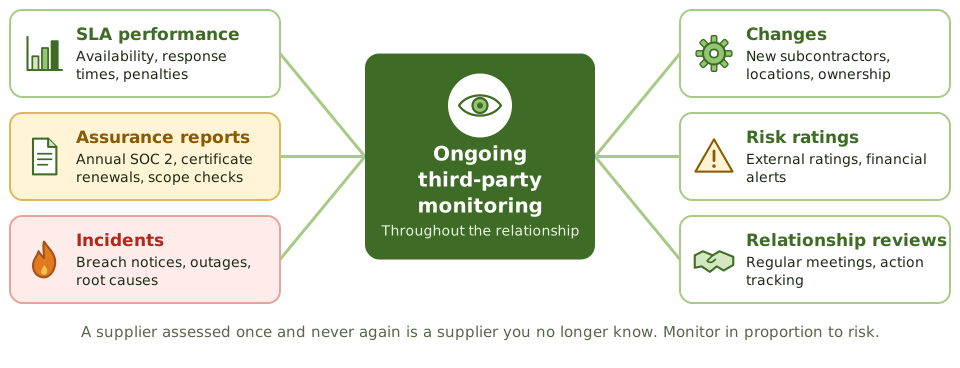
Third-party risk Monitoring Third Parties and Planning Exit
How to keep watching supplier risk during the relationship, and how a planned exit strategy protects the business if a supplier fails, is breached or has to be replaced.
Warning signs
- 1Repeated SLA breaches.
- 2Late or qualified assurance reports.
- 3New subcontractors or data locations without notice.
- 4Financial distress or change of ownership.
- 5Security incidents or poor incident communication.
Planning exit
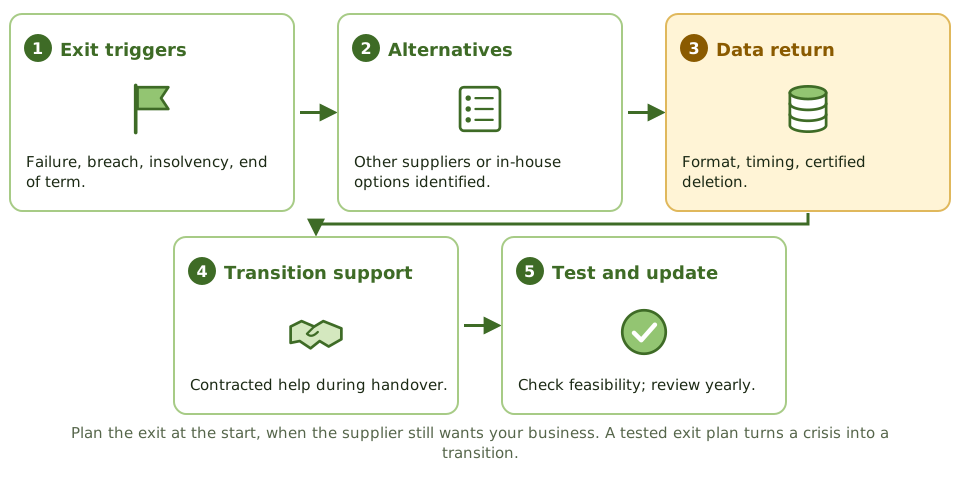
ExampleWhen a niche CRM provider announced it was closing, a firm with a tested exit plan moved to a new provider in eight weeks using contracted data exports. A competitor without one lost two months of customer history.
How the exam asks about it
| If the question asks… | The answer is usually… |
|---|
| How often to review a critical supplier | Regularly, in proportion to risk |
| BEST control for supplier failure risk | A tested exit plan and alternatives |
| When to plan exit | At the start of the relationship |
| At contract end | Revoke access; return or destroy data |
Key takeaways
- ✓Third-party risk changes during the contract; monitor in proportion to the supplier's tier.
- ✓Monitoring covers SLAs, assurance reports, incidents, changes, external ratings and relationship reviews.
- ✓Exit strategies should be planned at the start and tested for critical suppliers.
- ✓Exit plans cover triggers, alternatives, data return and deletion, and transition support.
- ✓Concentration on a single critical supplier is a risk in itself.
Exam traps
- !Assessing suppliers only once, before signing.
- !No exit plan until the supplier fails.
- !Forgetting to revoke supplier access and recover data at exit.
- !Ignoring changes in a supplier's subcontractors or ownership.
Issues and exceptions Managing Issues, Findings and Control Deviations
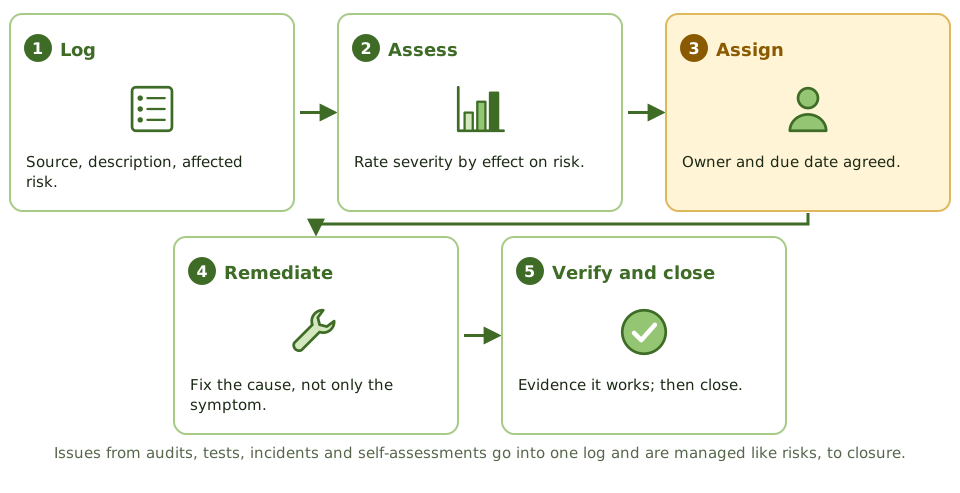
How findings from audits, control tests, incidents and self-assessments are logged, rated by their effect on risk, assigned and tracked to verified closure.
Link issues to risks
- 1Which risks does the issue affect?
- 2Does it change residual risk ratings?
- 3Does it reveal a missing scenario?
- 4Update the register when issues open and close.
ExampleA control test found 12 leavers with active accounts. Instead of disabling just those 12, the root cause (contractors missing from the HR feed) was fixed, and the access risk's residual rating was updated until the fix was verified.
How the exam asks about it
| If the question asks… | The answer is usually… |
|---|
| BEST basis for prioritising issues | Effect on risk |
| Before closing an issue | Verify the fix with evidence |
| Recurring findings | Address the root cause |
| Issue affects a key control | Re-assess the related risk |
Key takeaways
- ✓Issues come from audits, control tests, incidents, assessments and regulators; manage them in one log.
- ✓Rate each issue by its effect on risk, not by its source or how embarrassing it is.
- ✓Every issue needs an owner, an agreed action and a due date.
- ✓Fix the root cause, not just the symptom, so the issue doesn't recur.
- ✓Close issues only when evidence shows the fix works.
- ✓Update the related risks in the register when issues are raised and closed.
Exam traps
- !Closing an issue on management's word without evidence.
- !Treating audit findings as more important than internal test results by default.
- !Fixing the single example found instead of the process.
- !Not linking issues to the risks they affect.
Issues and exceptions Risk Acceptance, Exceptions and Exemptions
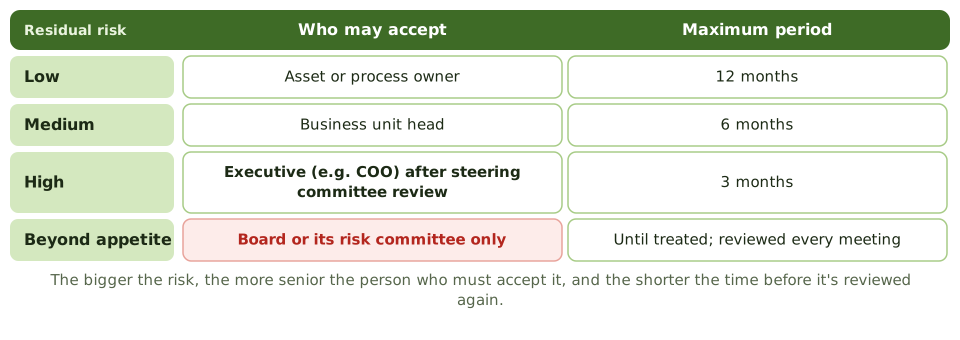
How risks are formally accepted at the right level, how policy exceptions and exemptions differ, and why every one needs an owner, conditions and a review date.
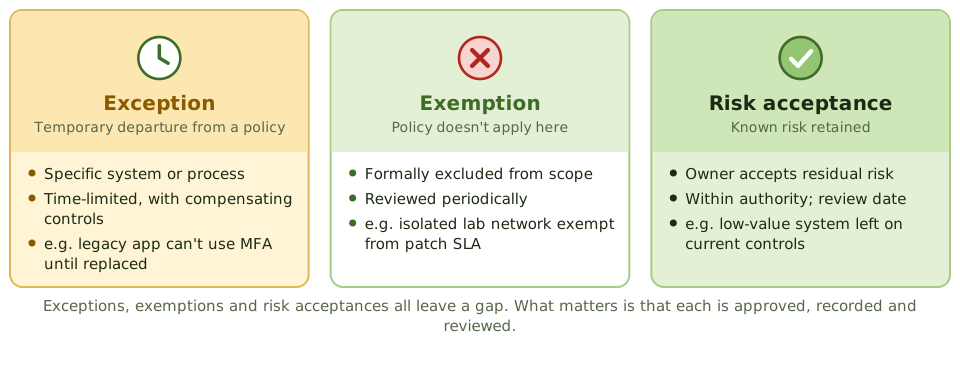
Exceptions, exemptions and acceptances
What every record needs
| Element | Why |
|---|
| Description of the risk or gap | Everyone knows what's accepted |
| Owner and approver | Accountability at the right level |
| Compensating controls | Reduce what's left |
| Conditions and expiry date | Forces review |
ExampleA legacy plant system can't be patched until replacement next year. The plant director accepts the risk for 12 months with network isolation and extra monitoring. At month 12, the replacement is late, and the acceptance goes back to the COO for renewal.
How the exam asks about it
| If the question asks… | The answer is usually… |
|---|
| Who accepts residual risk | The risk owner with suitable authority |
| Risk beyond appetite | Senior management or board acceptance |
| MOST important element of an acceptance | Owner, authority and review date |
| Accepted risk at expiry | Re-assess; renew, treat or close |
Key takeaways
- ✓Risk acceptance is a conscious, documented decision to retain a known risk.
- ✓Acceptance authority scales with the size of the risk; risks beyond appetite need the most senior approval.
- ✓An exception is a temporary, approved departure from a policy; an exemption formally takes something out of a policy's scope.
- ✓Every acceptance, exception and exemption needs an owner, compensating controls where possible and an expiry or review date.
- ✓Unreviewed acceptances quietly become permanent.
Exam traps
- !The risk practitioner or IT accepting risk for the business.
- !Accepting risk by doing nothing.
- !Acceptances with no expiry date.
- !Accepting a risk beyond appetite at a low level of authority.
Control design Control Frameworks and Their Purpose
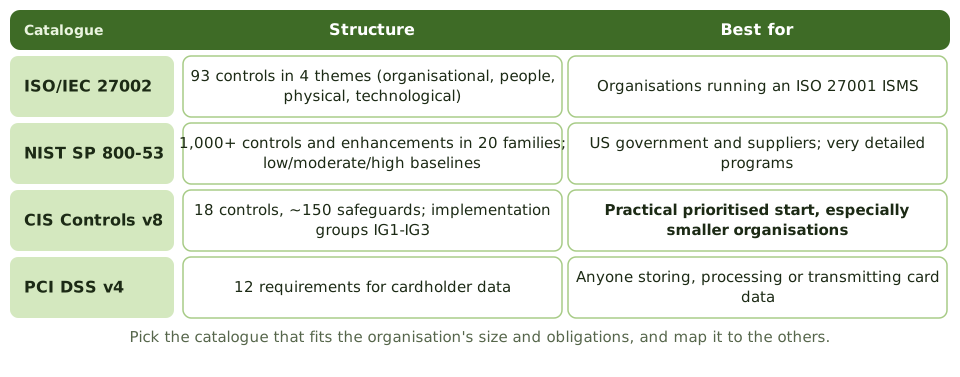
What control frameworks and catalogues are for, the main ones a CRISC candidate should recognise, and how to use them without letting the catalogue replace risk-based thinking.
Why use a control framework
Frameworks save the organisation from inventing controls from scratch, give auditors and regulators a familiar structure, and make gaps easier to spot. They're a starting point; risk assessment decides what's actually needed.
Use as a menu, not a checklist
- 1Start from the risk scenarios and appetite.
- 2Select controls that address those risks.
- 3Justify exclusions (e.g. a Statement of Applicability).
- 4Map selected controls to every relevant framework.
ExampleA company subject to ISO 27001 and PCI DSS maps one access review control to both. Auditors from each scheme test the same control, and the team runs one process instead of two.
How the exam asks about it
| If the question asks… | The answer is usually… |
|---|
| PRIMARY benefit of a control framework | Structured, tested set of controls and common language |
| How to choose controls from a catalogue | Based on risk assessment |
| Several frameworks apply | Map one control set to all |
| Framework compliance achieved | Doesn't on its own prove risk is within appetite |
Key takeaways
- ✓Control frameworks give a tested, structured set of controls and a common language.
- ✓Common catalogues include ISO/IEC 27002, NIST SP 800-53, CIS Controls, COBIT and PCI DSS.
- ✓Use frameworks as a menu: risk assessment decides which controls apply and how strongly.
- ✓Mapping one control set to several frameworks reduces duplication.
- ✓COSO's internal control framework underpins control thinking in many organisations.
Exam traps
- !Implementing every control in a catalogue regardless of risk.
- !Treating framework compliance as proof that risk is managed.
- !Running separate control programs for each framework.
- !Confusing a control framework with a risk management framework.
Control design Control Types and Functions
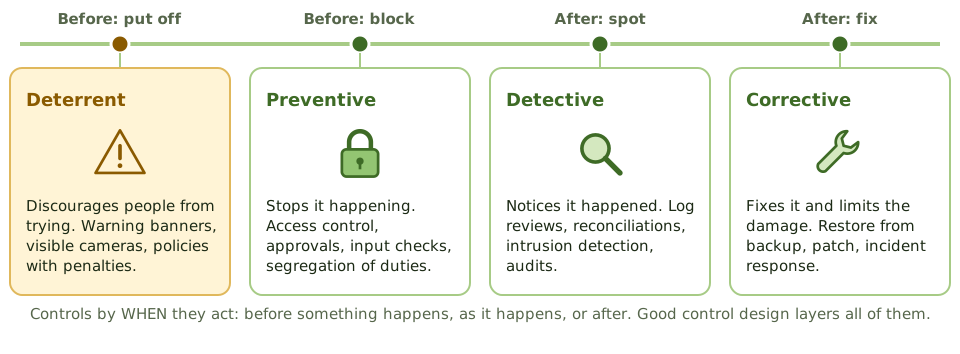
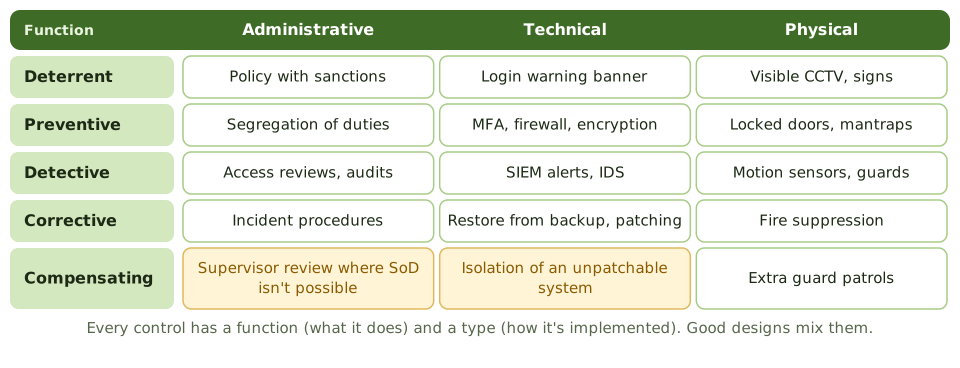
How controls are classified by function (deterrent, preventive, detective, corrective, compensating) and by type (administrative, technical, physical), and why good designs layer them.
Function and type together
Likelihood or impact?
| Function | Mainly reduces |
|---|
| Deterrent, preventive | Likelihood |
| Detective | Impact (by catching it early) |
| Corrective | Impact (by recovering) |
ExampleFor ransomware, MFA and patching are preventive, EDR alerts are detective, and immutable backups are corrective. If prevention fails, detection and correction keep a bad day from becoming a disaster.
How the exam asks about it
| If the question asks… | The answer is usually… |
|---|
| Restoring from backup | Corrective |
| Reviewing logs | Detective |
| Control replacing one that can't be used | Compensating |
| Reduce impact of a risk | Detective or corrective controls |
Key takeaways
- ✓Control functions describe when a control acts: deterrent and preventive before, detective during or after, corrective after.
- ✓Compensating controls provide equivalent protection when the preferred control isn't possible.
- ✓Control types describe how they're implemented: administrative, technical or physical.
- ✓Preventive controls reduce likelihood; detective and corrective controls reduce impact.
- ✓Layering different functions and types gives defence in depth.
Exam traps
- !Thinking preventive controls make detective controls unnecessary.
- !Classifying a backup restore as preventive; it's corrective.
- !Using a compensating control performed by the person with the conflict.
- !Relying on one type of control for a critical risk.
Control design Designing and Selecting Controls
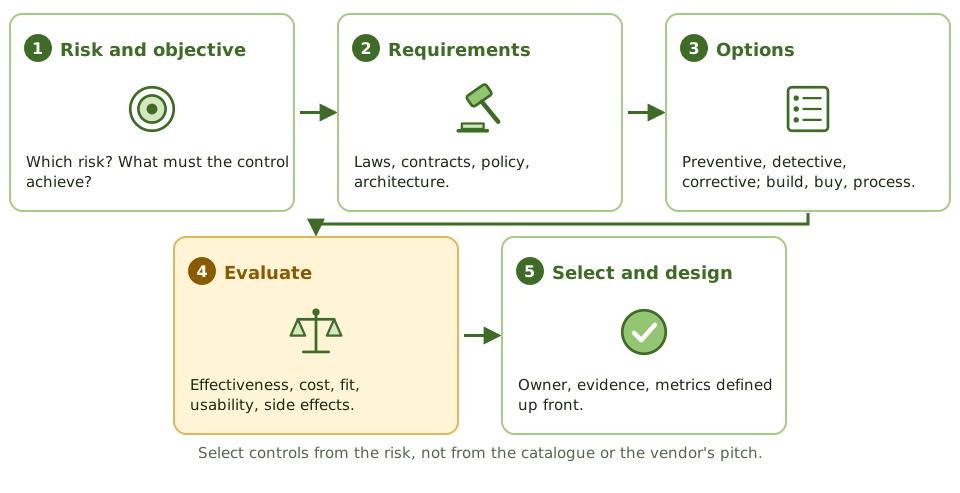
How to choose and design controls from the risk rather than the catalogue, weighing effectiveness, cost, fit and side effects, and building in ownership and evidence from the start.
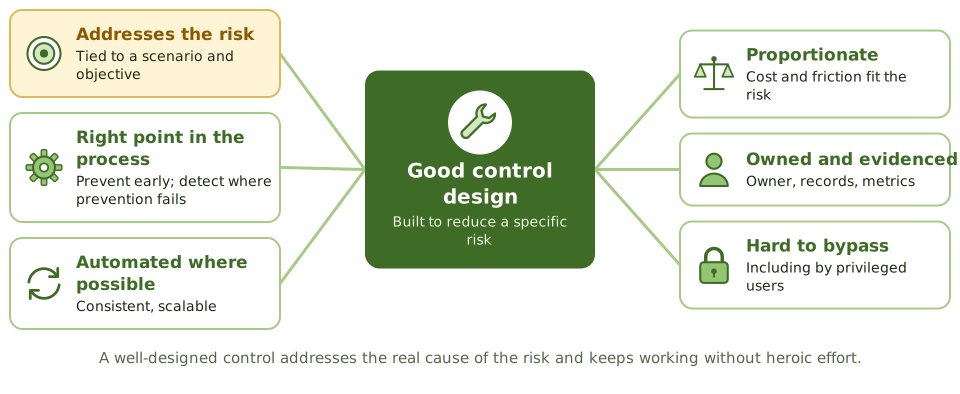
Principles of good design
Weighing the trade-offs
| Factor | Question |
|---|
| Effectiveness | How much does it reduce the risk? |
| Cost | Total cost over its life |
| Fit | Does it work with our processes and systems? |
| Usability | Will people use it or work around it? |
| Side effects | Does it create new risks or slow the business? |
ExampleTo reduce payment fraud, a manual call-back check was cheap but slow and often skipped. An automated rule that held new-payee payments for independent approval cost more but ran every time and was chosen.
How the exam asks about it
| If the question asks… | The answer is usually… |
|---|
| FIRST step in selecting a control | Understand the risk and control objective |
| MOST effective control type, all else equal | Automated preventive |
| Control people work around | Poor fit; redesign |
| When to define control evidence | At design |
Key takeaways
- ✓Start from the risk and the control objective, not from a product or catalogue.
- ✓Evaluate options for effectiveness, cost, fit with processes and architecture, usability and side effects.
- ✓Prefer automated, preventive controls where they fit, backed by detective controls.
- ✓Good design addresses the root cause, sits at the right point in the process and is hard to bypass.
- ✓Define the owner, evidence and metrics when the control is designed.
Exam traps
- !Selecting a control because a vendor recommends it.
- !Choosing the most technically advanced control regardless of fit.
- !Designing controls that privileged users can easily bypass.
- !Leaving ownership and evidence to be sorted out after go-live.
Control design Implementing Controls and Why Implementations Fail
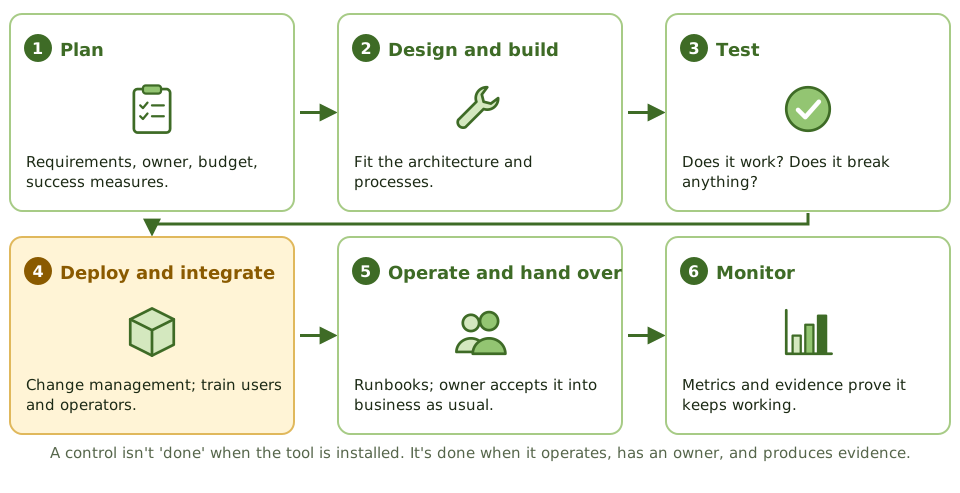
How a control moves from design to business as usual, the common reasons implementations fail, and how the risk practitioner checks that a control is genuinely operating.
Checking it's real
- 1Is there a named operational owner?
- 2Does it cover the full scope intended?
- 3Has it been tested in production conditions?
- 4Is evidence produced and retained?
- 5Has residual risk been re-assessed?
ExampleA DLP tool was bought and installed, and the data loss risk was marked 'treated'. A year later, testing showed the tool was in monitor-only mode with no one reviewing alerts. The risk had never really been reduced.
How the exam asks about it
| If the question asks… | The answer is usually… |
|---|
| When is a control implemented | When it operates, is owned and produces evidence |
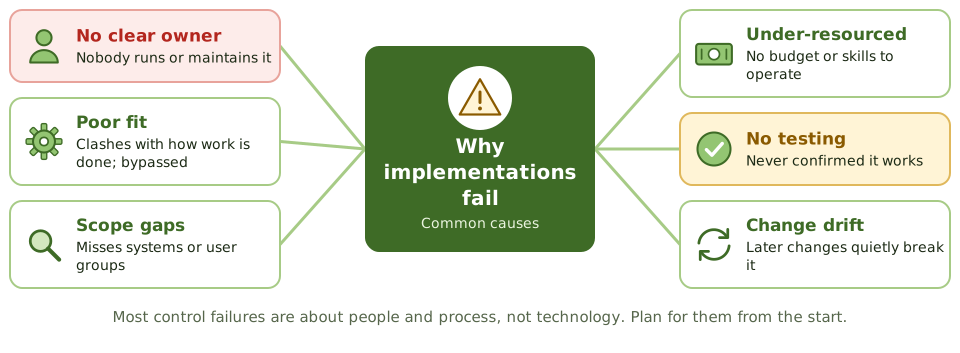
| MOST common cause of control failure | Lack of ownership or poor fit with processes |
| After a new control goes live | Test it and re-assess residual risk |
| Changes to a control | Through change management |
Key takeaways
- ✓A control is implemented when it operates, has an owner and produces evidence, not when a tool is installed.
- ✓Implementation follows plan, build, test, deploy, hand over and monitor.
- ✓Common failure causes: no owner, poor fit, scope gaps, lack of resources, no testing and later changes.
- ✓Changes to controls go through change management.
- ✓After implementation, reassess residual risk based on the control as it actually works.
Exam traps
- !Marking a risk treated once the tool is purchased.
- !Skipping testing because the vendor says the product works.
- !No handover to an operational owner.
- !Assuming a control stays effective after system changes.
Control testing Control Design versus Operating Effectiveness
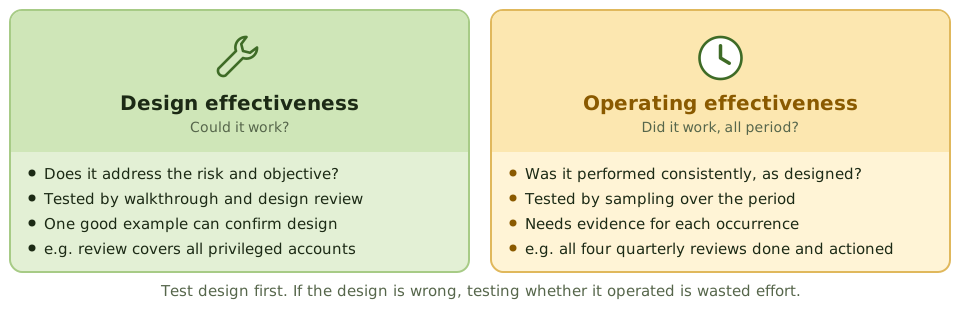
The two questions every control test answers (could it work, and did it work throughout the period?) and why design is tested first.
Design first
If an access review excludes administrator accounts, it can't control privileged access however diligently it's performed. Finding that design gap first saves time and points straight to the fix.
Evidence for each
| Question | Typical evidence |
|---|
| Design | Walkthrough, design documents, one example traced |
| Operation | Samples across the period, logs, sign-offs |
ExampleA change control was well designed: every change needed CAB approval. Sampling 40 changes found 9 deployed before approval during month-end. Design effective, operation not.
How the exam asks about it
| If the question asks… | The answer is usually… |
|---|
| Test FIRST | Design effectiveness |
| Control can't meet its objective | Design deficiency |
| Control not performed consistently | Operating deficiency |
| Evidence for operating effectiveness | Samples across the period |
Key takeaways
- ✓Design effectiveness asks whether the control, if performed as designed, would achieve its objective.
- ✓Operating effectiveness asks whether it was performed consistently, as designed, throughout the period.
- ✓Test design first; if the design is flawed, testing operation is wasted effort.
- ✓Design is often confirmed with a walkthrough; operation needs samples across the period.
- ✓Both must be effective for the control to reduce risk as expected.
Exam traps
- !Testing operation of a control whose design can't achieve its objective.
- !Concluding a control operated all year from one walkthrough.
- !Assuming a well-documented control operates.
- !Ignoring changes to a control during the period.
Control testing Control Testing: Objectives, Evidence and Frequency
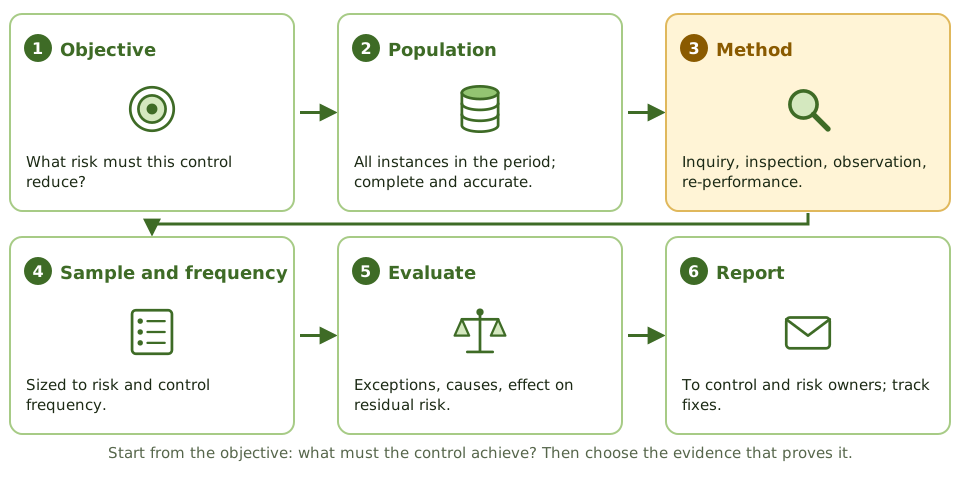
How to plan a control test from its objective, choose testing methods and evidence, size samples and set test frequency by risk, and turn results into decisions.
How often to test
| Factor | Effect on frequency |
|---|
| High risk or key control | Test more often |
| Recent failures or changes | Test more often |
| Automated, stable control | Test less often if change control is strong |
| Low risk, mature control | Test less often |
Evaluating exceptions
- 1What caused it: one-off or systemic?
- 2Does it change residual risk?
- 3Is a compensating control in place?
- 4Who must be told, and what's the fix?
ExampleAn access review test found 2 exceptions in 25. Both involved the same new manager who hadn't been trained. Training and a reminder fixed the cause; the risk rating stayed the same.
How the exam asks about it
| If the question asks… | The answer is usually… |
|---|
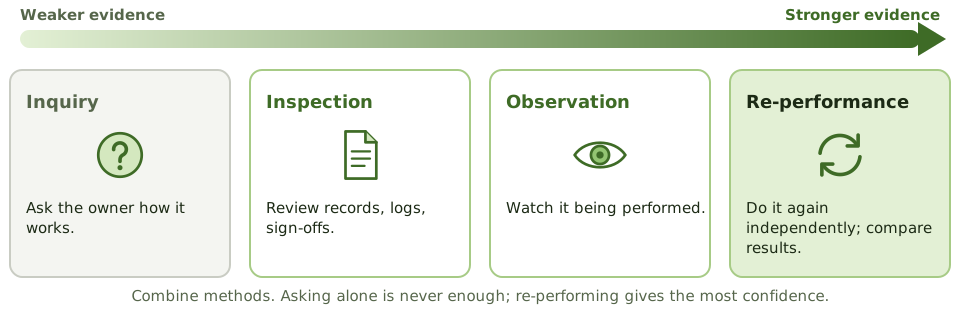
| Weakest form of evidence | Inquiry |
| Strongest form of evidence | Re-performance |
| BEST basis for test frequency | Risk and importance of the control |
| Test finds exceptions | Investigate cause and effect on risk |
Key takeaways
- ✓Start every test from the control objective: what risk must this control reduce?
- ✓Testing methods range from inquiry (weakest) through inspection and observation to re-performance (strongest).
- ✓Inquiry alone is never enough; combine methods.
- ✓Sample size and test frequency rise with the risk and the control's importance.
- ✓Exceptions must be investigated for cause and their effect on residual risk.
- ✓Results go to control and risk owners and feed the risk register.
Exam traps
- !Relying only on interviews as evidence.
- !Testing every control with the same frequency regardless of risk.
- !Ignoring exceptions because the overall pass rate looks high.
- !Using a population that isn't complete.
Risk data and treatment plans Building and Tracking Risk Action Plans
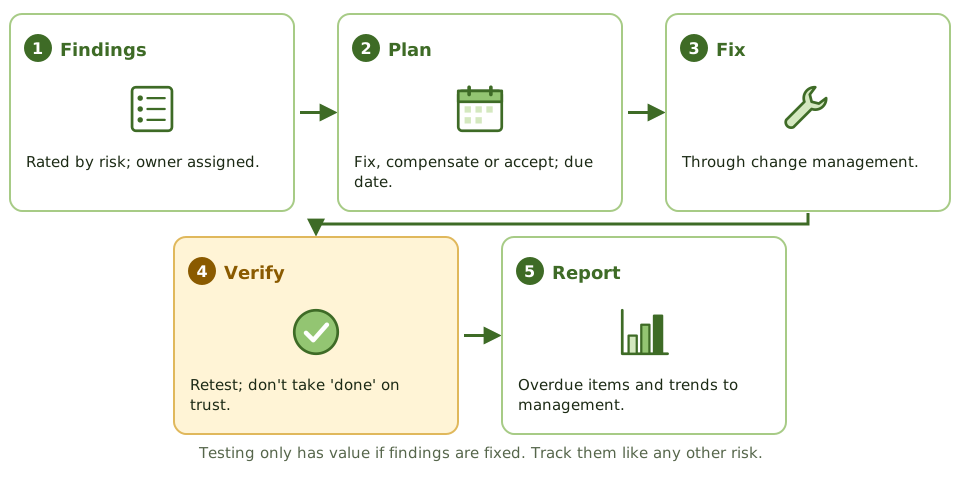
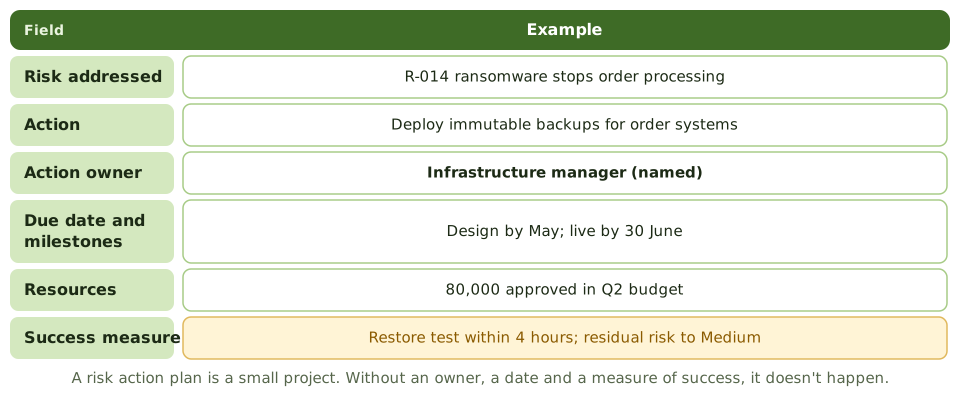
How a chosen risk response becomes an action plan with owners, dates, resources and success measures, and how progress is tracked and escalated until residual risk reaches its target.
Tracking progress
- 1 Plan approved by risk owner
- 2 Owner updates status regularly
- 3 Practitioner monitors and reports
- 4 Overdue items escalated
- 5 Residual risk verified
Success is risk reduced
A plan can complete every task and still miss its purpose. Success means the residual risk has reached the target agreed with the risk owner, confirmed by testing the new or improved controls.
ExampleAn action plan to reduce phishing risk delivered training to every employee on time. Simulated phishing showed click rates unchanged, so the plan was extended with MFA and reporting tools until the target was met.
How the exam asks about it
| If the question asks… | The answer is usually… |
|---|
| MOST important element of an action plan | Owner and due date |
| When is a plan complete | When target residual risk is verified |
| High-risk action is overdue | Escalate per the agreed path |
| Who approves the plan | The risk owner |
Key takeaways
- ✓A risk action plan turns a chosen response into specific, owned, dated actions.
- ✓Each plan needs an owner, milestones, resources and a measure of success tied to residual risk.
- ✓Track plans in the risk register or a linked tool, with regular status updates.
- ✓Overdue actions on high risks are escalated through the agreed path.
- ✓A plan is complete when the residual risk target is verified, not when tasks are ticked off.
Exam traps
- !Plans with no owner or due date.
- !Closing a risk when the plan is approved rather than delivered.
- !Measuring success by tasks completed instead of risk reduced.
- !Letting overdue actions on high risks drift without escalation.
Risk data and treatment plans Collecting and Aggregating Risk Data
Where risk data comes from, how to normalise and aggregate data from different sources so it means something, and how aggregation reveals concentrations of risk.
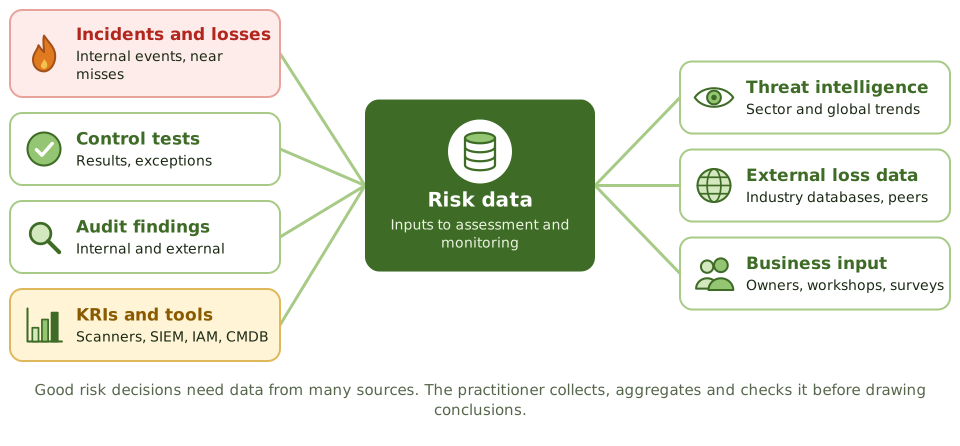
Where risk data comes from
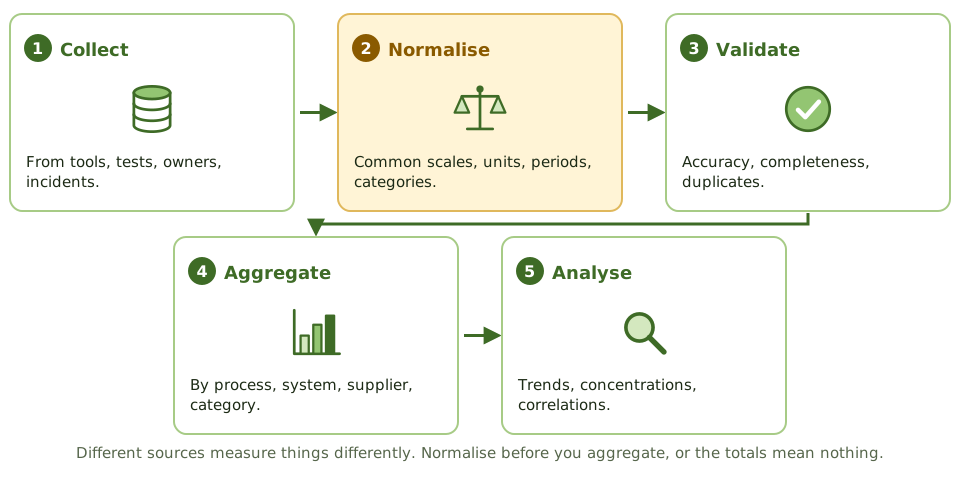
Normalise, then aggregate
What aggregation reveals
- 1Several medium risks on one critical supplier.
- 2The same control weakness across many systems.
- 3A business unit with many overdue actions.
- 4Risk rising in one category over several quarters.
ExampleThree business units each rated their reliance on one cloud identity provider as medium. Aggregated, it was the organisation's largest single point of failure, and it became a board-level risk.
How the exam asks about it
| If the question asks… | The answer is usually… |
|---|
| Before aggregating data from many sources | Normalise it |
| Benefit of aggregation | Reveals concentrations and trends |
| BEST way to improve timeliness | Automate collection |
| Several small risks on one supplier | Consider their combined effect |
Key takeaways
- ✓Risk data comes from incidents, control tests, audits, KRIs and tools, threat intelligence, external loss data and the business.
- ✓Normalise data (common scales, units, periods and categories) before aggregating it.
- ✓Aggregation by process, system, supplier or category reveals concentrations individual items hide.
- ✓Automate collection where possible to improve timeliness and reduce errors.
- ✓Every data source should have a known owner and definition.
Exam traps
- !Adding up scores from different scales.
- !Relying on a single data source.
- !Collecting data nobody uses for decisions.
- !Missing concentrations by looking only at individual risks.
Risk data and treatment plans Validating Risk Data Quality
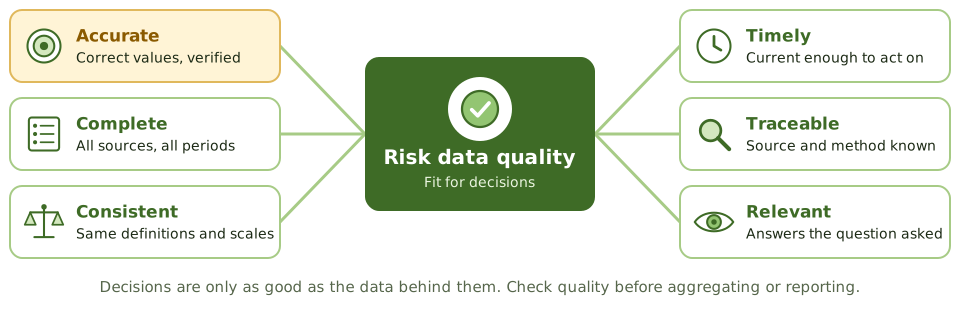
Why risk decisions depend on data quality, the dimensions of good risk data, and how the risk practitioner validates data before using it to rate, report or decide.
Validation checks
| Check | Example |
|---|
| Completeness | Scanner covers all servers in the CMDB? |
| Accuracy | Sample of records checked against source |
| Consistency | Same definition of 'critical' as last quarter? |
| Reasonableness | Outliers and sudden jumps investigated |
| Timeliness | Data date shown and recent enough |
Be honest about limits
Sometimes the data isn't perfect and a decision can't wait. That's fine, as long as the report says so: which data is missing, how estimates were made and how confident the practitioner is.
ExampleThe patching KRI showed 98% compliance. Validation found the scanner only covered servers on the main network; cloud servers weren't included. Including them dropped compliance to 81%, and the KRI turned amber.
How the exam asks about it
| If the question asks… | The answer is usually… |
|---|
| Before reporting a metric | Validate the underlying data |
| KRI suddenly improves sharply | Check data and definitions before celebrating |
| Data has known gaps | Disclose limitations in the report |
| MOST important data quality attribute for a decision | Accuracy and completeness |
Key takeaways
- ✓Risk data should be accurate, complete, consistent, timely, traceable and relevant.
- ✓Validate data before aggregating or reporting; bad data produces confident but wrong decisions.
- ✓Reconcile data with independent sources and check for gaps, duplicates and outliers.
- ✓Every metric and data feed needs a defined source, owner and calculation method.
- ✓Disclose known data limitations in reports rather than hiding them.
Exam traps
- !Reporting tool output without checking completeness.
- !Mixing definitions between periods so trends are false.
- !Hiding data gaps to make a report look cleaner.
- !Assuming automated data is always accurate.
Monitoring and metrics KRIs, KPIs and KCIs
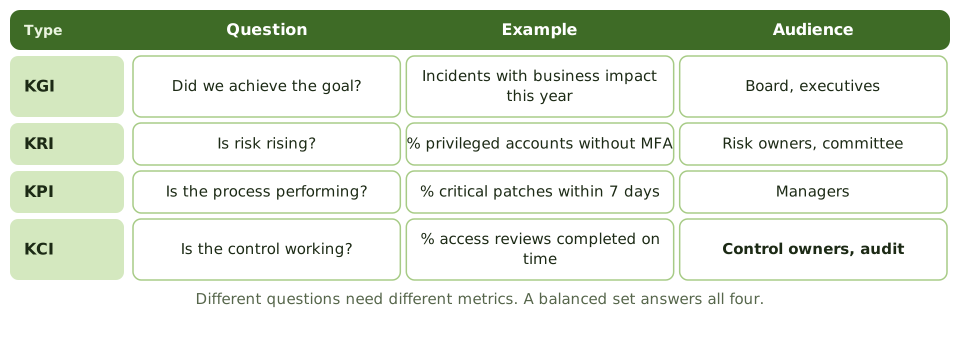
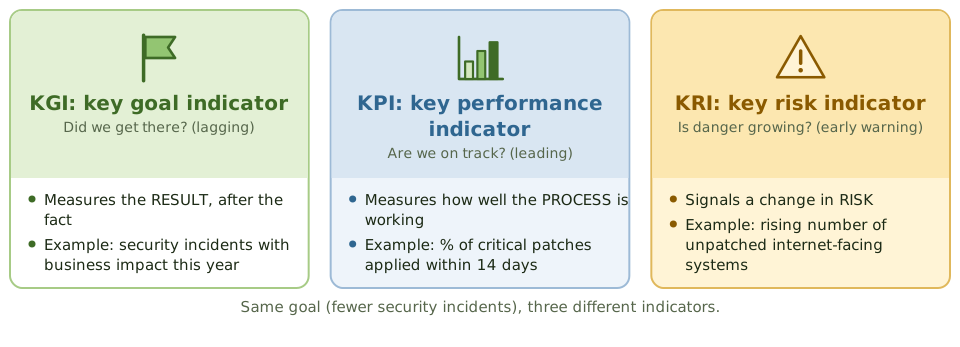
The difference between key risk, performance, control and goal indicators, what makes each useful, and how to choose indicators that warn before risk materialises.
Same goal, different indicators
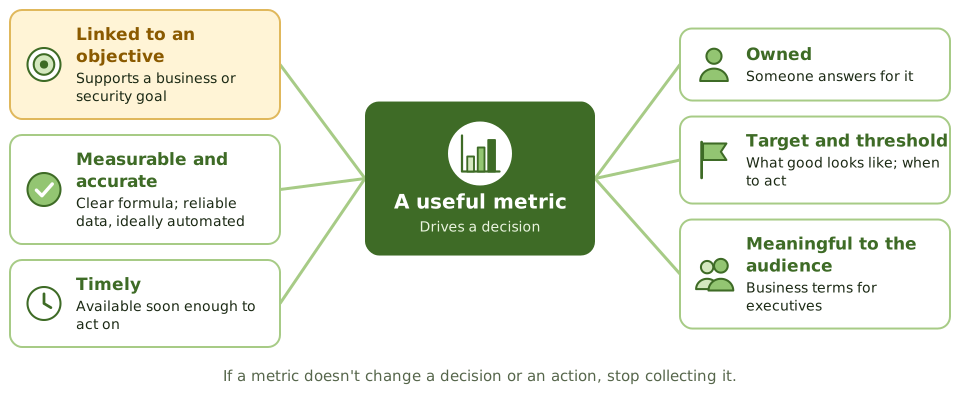
What makes a good indicator
Leading versus lagging
| Lagging (after the fact) | Leading (early warning) |
|---|
| Number of breaches last year | Privileged accounts without MFA |
| Outage hours last quarter | Failed backup tests this month |
| Fraud losses | Overdue supplier bank-detail verifications |
ExampleA bank chose 'percentage of high-risk vendors without a current assessment' as a KRI for third-party risk. When it rose from 5% to 22% after a reorganisation, assessments were restarted before any incident occurred.
How the exam asks about it
| If the question asks… | The answer is usually… |
|---|
| MOST useful characteristic of a KRI | It's a leading indicator of risk change |
| Measures whether a control works | KCI |
| Measures process performance | KPI |
| Who should help choose KRIs | The risk owner |
Key takeaways
- ✓KRIs signal changes in risk; KPIs measure process performance; KCIs measure control effectiveness; KGIs measure goal achievement.
- ✓The best KRIs are leading indicators: they change before the risk materialises.
- ✓Good indicators are linked to a risk or objective, measurable, timely, owned and have thresholds.
- ✓Indicators should be chosen with the risk owner and reviewed as risks change.
- ✓A small set of meaningful indicators beats a long list nobody reads.
Exam traps
- !Using lagging measures such as incident counts as early warnings.
- !Confusing a KPI (process performance) with a KRI (risk change).
- !Indicators with no threshold or owner.
- !Collecting indicators because the data is easy to get.
Monitoring and metrics Thresholds, Escalation Triggers and Appetite
How KRI thresholds are set inside risk tolerance so that warnings arrive in time to act, and how each threshold triggers a named response and escalation.
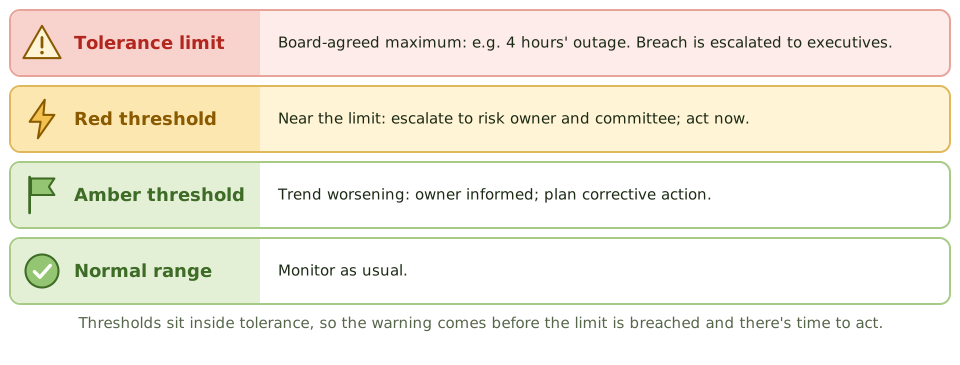
Thresholds inside tolerance
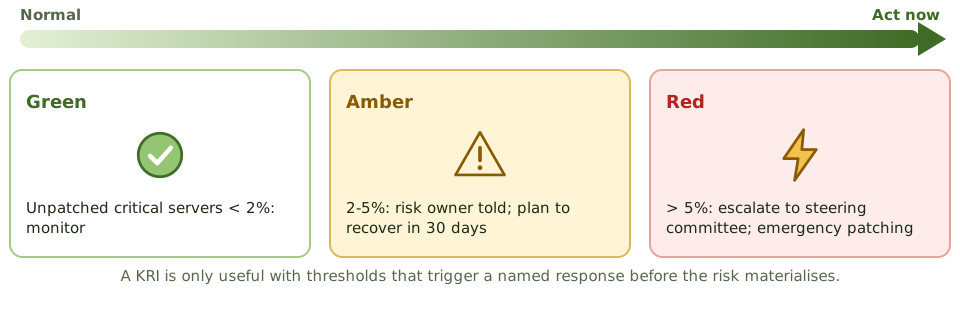
Each level triggers action
Setting thresholds
- 1Start from the tolerance agreed with the owner.
- 2Use history to see normal variation.
- 3Allow lead time to act before the limit.
- 4Name the response and recipient for each level.
ExampleTolerance for payment platform outage is 2 hours a quarter. The amber threshold triggers at 60 minutes cumulative, giving operations time to fix underlying issues before the board's limit is reached.
Don't move the goalposts
When a KRI turns red, the right reaction is to respond, not to raise the threshold. Thresholds change only when appetite, the business or the risk itself changes, and that change is approved and recorded.
How the exam asks about it
| If the question asks… | The answer is usually… |
|---|
| Where to set KRI thresholds | Inside tolerance, with time to act |
| KRI breaches its threshold | Follow the agreed escalation and response |
| Basis for thresholds | Risk appetite and tolerance |
| Owner wants to raise a red threshold | Only if appetite or risk has changed, with approval |
Key takeaways
- ✓Thresholds turn indicators into action: each level triggers a defined response.
- ✓Set thresholds inside tolerance so there's time to act before the limit is breached.
- ✓Thresholds come from risk appetite and tolerance agreed with risk owners.
- ✓Each threshold names who is told and what must happen.
- ✓Review thresholds when appetite, the business or the risk changes, not to make a red indicator green.
Exam traps
- !Setting thresholds at the tolerance limit, leaving no time to act.
- !Raising a threshold to stop an indicator showing red.
- !Thresholds with no defined response or owner.
- !One threshold level for every indicator regardless of risk.
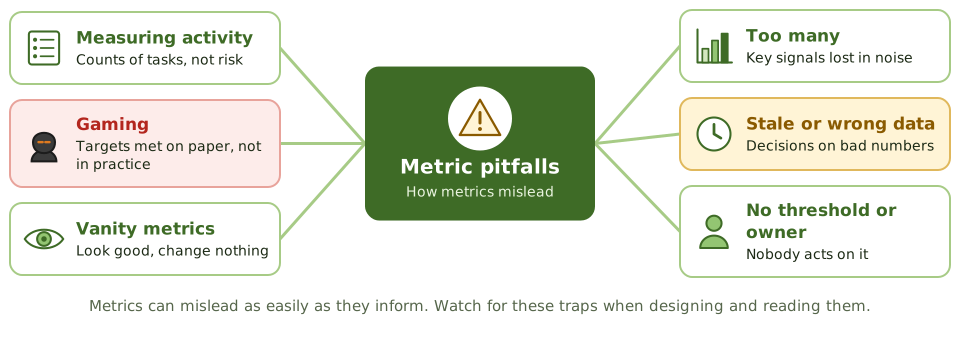
Monitoring and metrics Metric Pitfalls and Misuse
How risk metrics mislead (measuring activity instead of risk, gaming, vanity metrics, overload and bad data) and how the risk practitioner designs and reads metrics to avoid it.
Activity versus risk
| Activity metric | Risk-focused alternative |
|---|
| Scans run per month | Critical vulnerabilities open past deadline |
| Policies published | Exceptions open beyond expiry |
| Training sessions held | Phishing simulation report rate |
Gaming
When a number becomes a target, people find ways to hit it. Closing tickets without fixing problems, or reclassifying incidents to a lower severity, makes metrics look good while risk stays the same.
ExampleA team's target was closing vulnerabilities within 30 days. Closure rates hit 99%, but sampling found many were closed as 'risk accepted' without any approval. The metric was redesigned to count only verified fixes.
Keeping metrics honest
- 1Pair each metric with a quality check or sample.
- 2Watch for sudden improvements.
- 3Keep a small set of meaningful indicators.
- 4Retire metrics that don't drive decisions.
How the exam asks about it
| If the question asks… | The answer is usually… |
|---|
| All metrics green, but a major incident occurred | Metrics measure the wrong things |
| Weakness of activity metrics | Don't show changes in risk |
| Metric improves suddenly | Verify data and behaviour |
| Too many metrics | Focus on a few that drive decisions |
Key takeaways
- ✓Metrics that count activity can stay green while risk grows.
- ✓Targets tied to rewards invite gaming; check that behaviour matches the numbers.
- ✓Too many metrics hide the important signals.
- ✓Metrics need owners, thresholds and accurate data to drive action.
- ✓Retire metrics that no longer support a decision.
Exam traps
- !Reporting the number of policies or training sessions as risk metrics.
- !Celebrating a sharp improvement without checking how it was achieved.
- !Adding more metrics when the real problem is poor ones.
- !Ignoring a metric because it's always red.
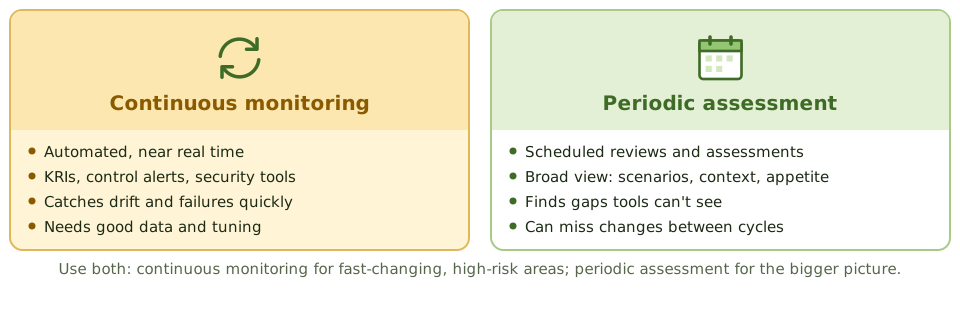
Monitoring and metrics Continuous Monitoring versus Periodic Assessment
How continuous, automated monitoring of risks and controls complements periodic assessments, what each is good at, and where each fits in the risk program.
Two complementary approaches
Where continuous monitoring fits
- 1Privileged access and configuration changes.
- 2Patch and vulnerability status.
- 3Backup success and recovery tests.
- 4Payment and transaction anomalies.
- 5Cloud configuration drift.
ExampleA cloud posture tool alerts within minutes when a storage bucket is made public. The annual risk assessment still reviews whether cloud governance, ownership and appetite fit the business's growing cloud use.
How the exam asks about it
| If the question asks… | The answer is usually… |
|---|
| Main benefit of continuous monitoring | Timely detection of changes and failures |
| Does it replace risk assessment? | No; they complement each other |
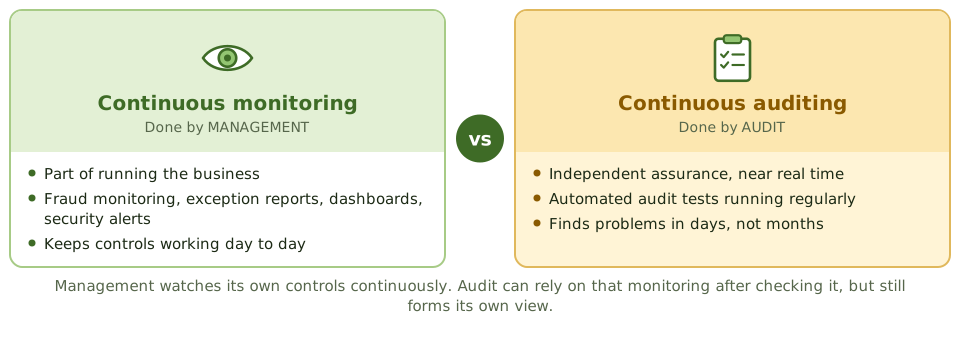
| Who owns continuous monitoring | Management |
| Monitoring alerts nobody reviews | Little value; assign ownership |
Key takeaways
- ✓Continuous monitoring uses automated data to watch risks and controls in near real time.
- ✓Periodic assessments give the broad view: context, scenarios, appetite and gaps tools can't see.
- ✓Use continuous monitoring for fast-changing, high-risk areas and key controls.
- ✓Monitoring is a management responsibility; audit may use it but stays independent.
- ✓Automated monitoring needs good data, tuning and someone to act on alerts.
Exam traps
- !Thinking continuous monitoring replaces risk assessment.
- !Relying only on annual assessments for fast-changing risks.
- !Deploying monitoring tools with nobody reviewing the output.
- !Confusing management's continuous monitoring with audit's continuous auditing.
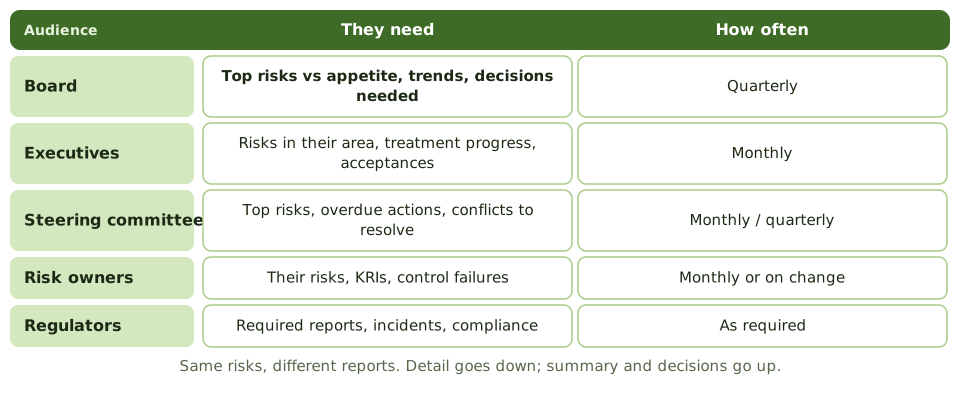
Reporting Tailoring Risk Reports to the Audience
How the same risk information is reported differently to the board, executives, committees, risk owners and regulators, and what every good risk report contains.
Same risks, different reports
What every report needs
- 1What's changed since last time, and why.
- 2Risks against appetite, with trends.
- 3Progress on treatment and overdue actions.
- 4Decisions or support needed.
- 5Data date and known limitations.
Writing for the board
| Instead of… | Say… |
|---|
| 147 critical vulnerabilities | Customer portal breach risk is above appetite |
| EDR coverage 82% | 1 in 5 laptops could spread ransomware undetected |
| SIEM ingested 2 billion events | (Leave it out) |
ExampleA quarterly board risk report was cut from 40 pages to 4: top risks against appetite, three trends, two overdue actions and one decision needed. The board discussed risk for the first time instead of skimming.
How the exam asks about it
| If the question asks… | The answer is usually… |
|---|
| MOST important content for the board | Top risks against appetite, in business terms |
| Why tailor reports | Each audience needs different detail to decide |
| Report risk owners need | Their risks, KRIs and action status |
| Board receives the full register | Summarise into a risk profile |
Key takeaways
- ✓Different audiences need different detail: summary and decisions go up, detail goes down.
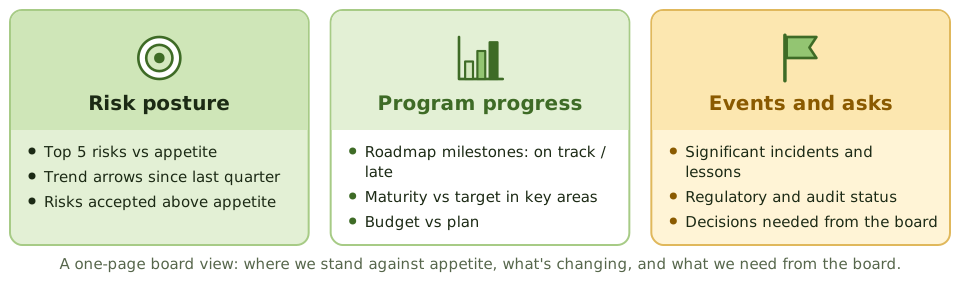
- ✓Board reports show top risks against appetite, trends and decisions needed, in business terms.
- ✓Risk owners need their risks, KRIs, control failures and action status.
- ✓Good reports are accurate, timely, consistent, concise and explain what's changed and why.
- ✓Reports should lead to decisions; say clearly what's being asked of the reader.
Exam traps
- !Sending the board the full risk register.
- !Reporting technical metrics to executives.
- !Changing formats and scales every period, hiding trends.
- !Reports that inform but never ask for a decision.
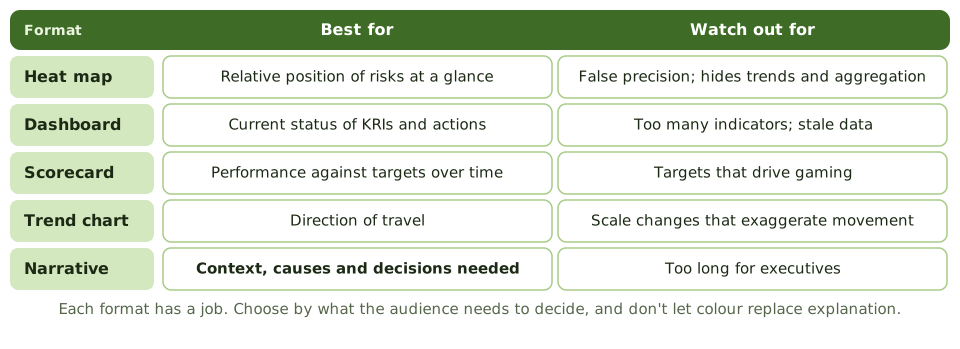
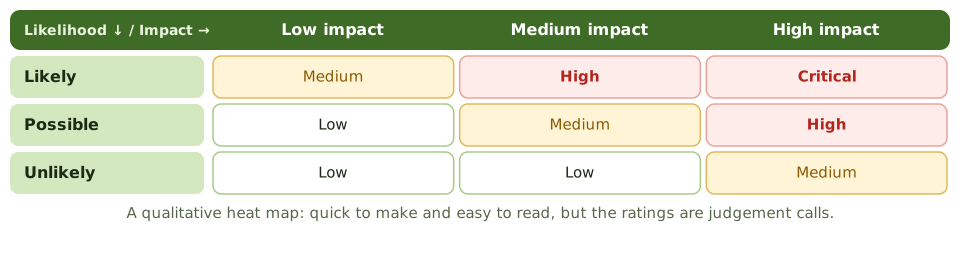
Reporting Heat Maps, Dashboards and Scorecards
The visual formats used in risk reporting, what each is best at, how they can mislead, and how to design a one-page view that leads to decisions.
Making visuals honest
- 1Show the appetite line or tolerance on the chart.
- 2Add trend arrows or previous positions.
- 3Keep scales the same every period.
- 4Add two or three sentences on what it means.
ExampleA heat map showed every top risk in the same red box quarter after quarter. Adding arrows for movement showed two risks improving and one getting worse, which focused the board's attention on the right one.
How the exam asks about it
| If the question asks… | The answer is usually… |
|---|
| Main benefit of a heat map | Quick view of relative risk priority |
| Main weakness of a heat map | Subjective; hides trends and aggregation |
| Best format for tracking against targets | Scorecard |
| Make a dashboard more useful | Fewer indicators with context and trends |
Key takeaways
- ✓Heat maps show the relative position of risks by likelihood and impact.
- ✓Dashboards show the current status of indicators and actions; scorecards track performance against targets.
- ✓Visuals need context: trends, appetite lines and a short narrative.
- ✓Heat maps can hide trends, aggregation and uncertainty, and imply false precision.
- ✓Choose the format by what the audience must decide.
Exam traps
- !Letting colours replace explanation.
- !Treating heat map positions as precise measurements.
- !Dashboards so crowded the key signal is lost.
- !Changing scales between reports so trends look different.
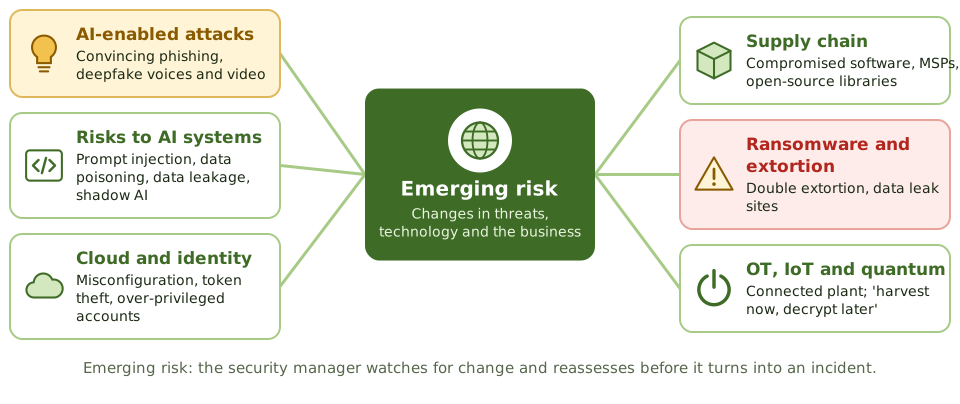
Emerging risk Identifying and Assessing Emerging Risks
What emerging risks are, where the early signals come from, and how to assess risks that are uncertain, fast-moving and hard to quantify.
What makes a risk emerging
Emerging risks are new, or changing quickly, and hard to size because there's little history. Generative AI, quantum computing, new regulation and new attack methods have all been emerging risks. The challenge is acting early without overreacting.
Assessing under uncertainty
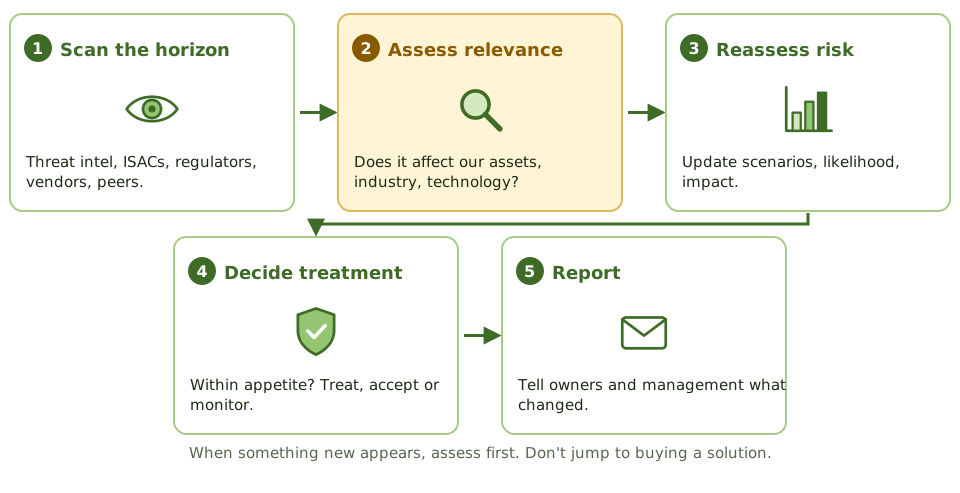
ExampleWhen staff began pasting customer data into public AI chatbots, the practitioner didn't ban AI outright. A quick scenario analysis showed data leakage was the main risk, leading to an approved tool with data controls and clear guidance.
Useful techniques
- 1Scenario analysis with best, likely and worst cases.
- 2Expert judgement using Delphi.
- 3Ranges instead of single numbers.
- 4Watch lists reviewed regularly.
How the exam asks about it
| If the question asks… | The answer is usually… |
|---|
| FIRST step with an emerging risk | Assess relevance to the organisation |
| Little data available | Use scenarios and expert judgement |
| New technology adopted by staff | Assess risk before banning or approving |
| Where to find early signals | Threat intelligence, regulators, industry bodies |
Key takeaways
- ✓Emerging risks are new or changing risks whose likelihood and impact are uncertain.
- ✓Signals come from threat intelligence, regulators, technology trends, industry bodies, peers and internal incidents.
- ✓Assess relevance first: does it affect our assets, sector, technology or objectives?
- ✓Use scenarios and ranges rather than precise estimates when data is scarce.
- ✓Assess before acting; don't jump to buying a solution for a risk not yet understood.
Exam traps
- !Ignoring a risk because there's no data on it yet.
- !Buying a tool before assessing whether the risk applies.
- !Treating every headline as a top risk.
- !Waiting for the annual assessment to consider new risks.
Emerging risk Integrating Emerging Risk into Decisions
How emerging risks move from a watch list into the normal risk process, with scenarios, owners, indicators and a place in reports, so leaders can make timely decisions.
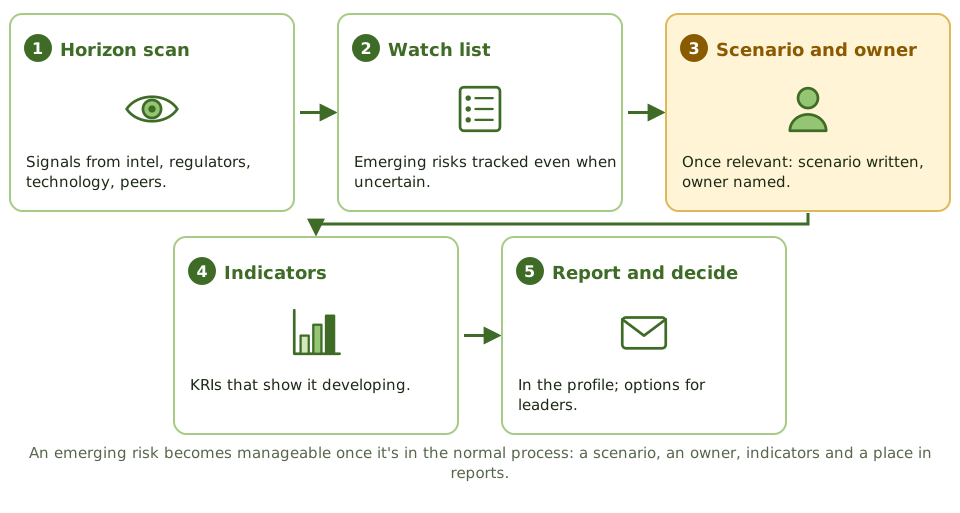
From watch list to register
Reporting uncertainty honestly
Emerging risks rarely fit a heat map neatly. Report them with ranges and a confidence level, explain what would change the assessment, and set out the options. Leaders can decide well with uncertain information if it's presented honestly.
Response options
| Option | When it fits |
|---|
| Monitor | Relevance unclear; watch indicators |
| Pilot with guardrails | Opportunity worth exploring safely |
| Early controls | Clear risk, low-cost protection available |
| Avoid for now | Risk clearly beyond appetite |
ExamplePost-quantum cryptography was on a bank's watch list for three years. When standards were published and regulators issued guidance, it moved into the register with an owner, an inventory of affected systems and a migration KRI.
How the exam asks about it
| If the question asks… | The answer is usually… |
|---|
| How to track uncertain new risks | Watch list reviewed regularly |
| Emerging risk becomes relevant | Add to register with scenario and owner |
| Reporting an emerging risk | Include uncertainty and options |
| New opportunity with unclear risk | Pilot with guardrails |
Key takeaways
- ✓Keep a watch list of emerging risks even when they're too uncertain to rate precisely.
- ✓Once relevant, give each emerging risk a scenario, an owner and indicators.
- ✓Report emerging risks alongside established ones, with honest uncertainty.
- ✓Options may include monitoring, small pilots with guardrails, or early controls.
- ✓Review the watch list regularly; some risks fade, others become top risks.
Exam traps
- !Leaving emerging risks outside the register until they cause an incident.
- !Reporting emerging risks with false precision.
- !Assuming emerging risks can't be owned.
- !Never removing items from the watch list.