Topics in this domain
- Risk Response Options: Accept, Mitigate, Transfer, Avoid
- Aligning Responses with Appetite and Tolerance
- Cost-Benefit Analysis of Risk Responses
- Bias in Risk Decisions and Reporting
- Risk Owners and Control Owners
- RACI and Escalation
- Third-Party Risk Governance and Due Diligence
- Contracts, SLAs and the Right to Audit
- Monitoring Third Parties and Planning Exit
- Managing Issues, Findings and Control Deviations
- Risk Acceptance, Exceptions and Exemptions
- Control Frameworks and Their Purpose
- Control Types and Functions
- Designing and Selecting Controls
- Implementing Controls and Why Implementations Fail
- Control Design versus Operating Effectiveness
- Control Testing: Objectives, Evidence and Frequency
- Building and Tracking Risk Action Plans
- Collecting and Aggregating Risk Data
- Validating Risk Data Quality
- KRIs, KPIs and KCIs
- Thresholds, Escalation Triggers and Appetite
- Metric Pitfalls and Misuse
- Continuous Monitoring versus Periodic Assessment
- Tailoring Risk Reports to the Audience
- Heat Maps, Dashboards and Scorecards
- Identifying and Assessing Emerging Risks
- Integrating Emerging Risk into Decisions
Metric Pitfalls and Misuse
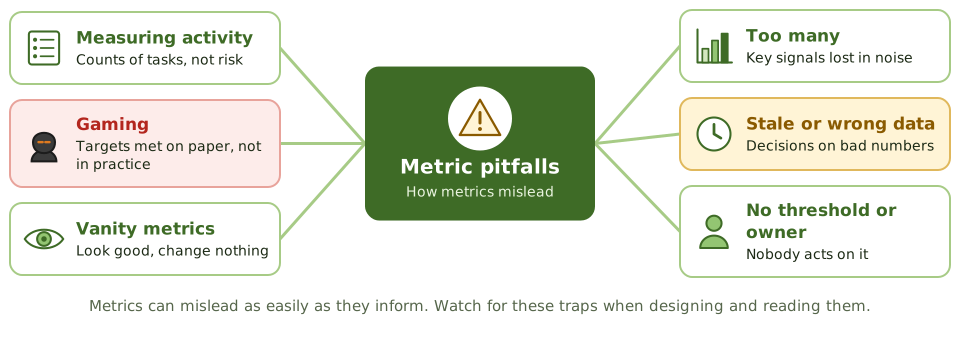
How metrics mislead
Activity versus risk
| Activity metric | Risk-focused alternative |
|---|---|
| Scans run per month | Critical vulnerabilities open past deadline |
| Policies published | Exceptions open beyond expiry |
| Training sessions held | Phishing simulation report rate |
Gaming
When a number becomes a target, people find ways to hit it. Closing tickets without fixing problems, or reclassifying incidents to a lower severity, makes metrics look good while risk stays the same.
Example. A team’s target was closing vulnerabilities within 30 days. Closure rates hit 99%, but sampling found many were closed as “risk accepted” without any approval. The metric was redesigned to count only verified fixes.
Keeping metrics honest
- Pair each metric with a quality check or sample.
- Watch for sudden improvements.
- Keep a small set of meaningful indicators.
- Retire metrics that don’t drive decisions.
How the exam asks about it
| If the question asks… | The answer is usually… |
|---|---|
| All metrics green, but a major incident occurred | The metrics measure the wrong things |
| Weakness of activity metrics | They don’t show changes in risk |
| Metric improves suddenly | Verify the data and the behaviour behind it |
| Too many metrics | Focus on a few that drive decisions |
In short
- Metrics that count activity can stay green while risk grows.
- Targets tied to rewards invite gaming; check that behaviour matches the numbers.
- Too many metrics hide the important signals.
- Metrics need owners, thresholds and accurate data to drive action.
- Retire metrics that no longer support a decision.
Exam traps
- Reporting the number of policies or training sessions as risk metrics.
- Celebrating a sharp improvement without checking how it was achieved.
- Adding more metrics when the real problem is poor ones.
- Ignoring a metric because it's always red.
Slides
Click the slide and use the arrow keys. F toggles full screen.
How metrics mislead
1 / 8