Topics in this domain
- Risk Response Options: Accept, Mitigate, Transfer, Avoid
- Aligning Responses with Appetite and Tolerance
- Cost-Benefit Analysis of Risk Responses
- Bias in Risk Decisions and Reporting
- Risk Owners and Control Owners
- RACI and Escalation
- Third-Party Risk Governance and Due Diligence
- Contracts, SLAs and the Right to Audit
- Monitoring Third Parties and Planning Exit
- Managing Issues, Findings and Control Deviations
- Risk Acceptance, Exceptions and Exemptions
- Control Frameworks and Their Purpose
- Control Types and Functions
- Designing and Selecting Controls
- Implementing Controls and Why Implementations Fail
- Control Design versus Operating Effectiveness
- Control Testing: Objectives, Evidence and Frequency
- Building and Tracking Risk Action Plans
- Collecting and Aggregating Risk Data
- Validating Risk Data Quality
- KRIs, KPIs and KCIs
- Thresholds, Escalation Triggers and Appetite
- Metric Pitfalls and Misuse
- Continuous Monitoring versus Periodic Assessment
- Tailoring Risk Reports to the Audience
- Heat Maps, Dashboards and Scorecards
- Identifying and Assessing Emerging Risks
- Integrating Emerging Risk into Decisions
Collecting and Aggregating Risk Data
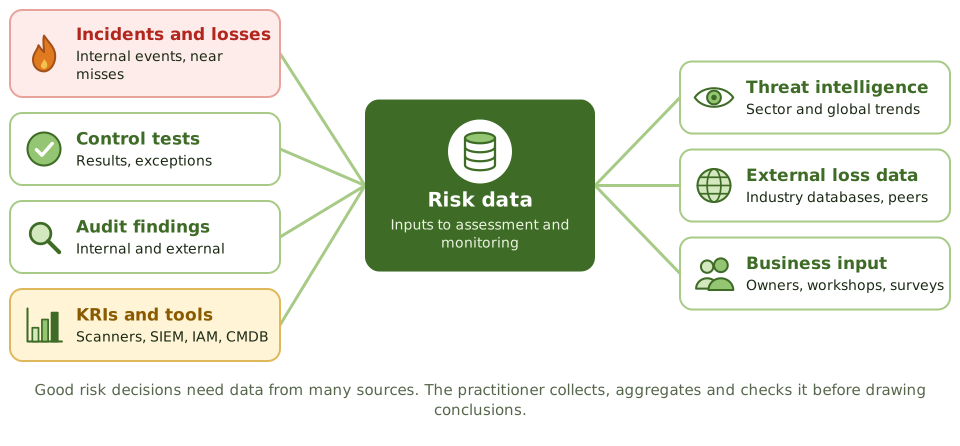
Where risk data comes from
Normalise, then aggregate
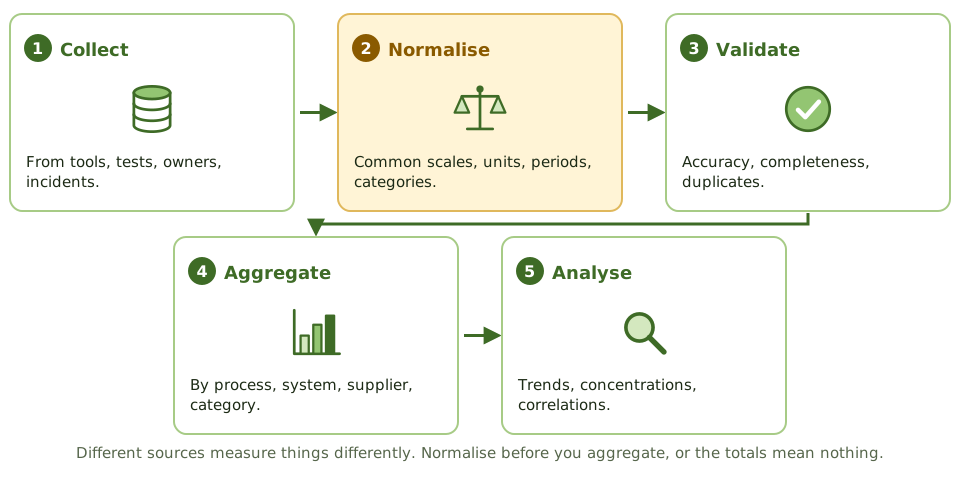
Different sources measure things differently. Normalise them to common scales, units, periods and categories before aggregating, or the totals mean nothing.
What aggregation reveals
- Several medium risks on one critical supplier.
- The same control weakness across many systems.
- A business unit with many overdue actions.
- Risk rising in one category over several quarters.
Example. Three business units each rated their reliance on one cloud identity provider as medium. Aggregated, it was the organisation’s largest single point of failure, and it became a board-level risk.
How the exam asks about it
| If the question asks… | The answer is usually… |
|---|---|
| Before aggregating data from many sources | Normalise it |
| Benefit of aggregation | Reveals concentrations and trends |
| BEST way to improve timeliness | Automate collection |
| Several small risks on one supplier | Consider their combined effect |
In short
- Risk data comes from incidents, control tests, audits, KRIs and tools, threat intelligence, external loss data and the business.
- Normalise data (common scales, units, periods and categories) before aggregating it.
- Aggregation by process, system, supplier or category reveals concentrations individual items hide.
- Automate collection where possible to improve timeliness and reduce errors.
- Every data source should have a known owner and definition.
Exam traps
- Adding up scores from different scales.
- Relying on a single data source.
- Collecting data nobody uses for decisions.
- Missing concentrations by looking only at individual risks.
Slides
Click the slide and use the arrow keys. F toggles full screen.
Where risk data comes from
Normalise, then aggregate
1 / 7