Topics in this domain
- Risk Management Concepts and Frameworks
- Inherent Risk, Residual Risk, Appetite and Tolerance
- Threat Actors, Motivations and Attack Vectors
- The Evolving Threat Landscape: AI, Cloud and Supply Chain
- Threat Modelling and Cyber Threat Intelligence
- Vulnerability Assessment and Scanning
- Control Deficiencies and Security Gap Analysis
- The Risk Assessment Process
- Qualitative Risk Analysis: Likelihood and Impact
- Quantitative Risk Analysis: SLE, ALE and Loss Estimation
- Risk Scenarios and Prioritisation
- Risk Treatment Options: Mitigate, Transfer, Avoid, Accept
- Risk Acceptance: Approval, Expiry and Review
- Cost-Benefit Analysis for Risk Treatment
- Risk Ownership vs Control Ownership
- RACI and Risk Escalation Paths
- The Risk Register
- Continuous Risk Monitoring and Key Risk Indicators
- Risk Reporting to Executives and the Board
- Integrating Risk Management into Business and IT Processes
Qualitative Risk Analysis: Likelihood and Impact
Rating without hard numbers
Most organisations don’t have reliable data on how often each kind of incident happens, or exactly what it would cost. Qualitative analysis uses informed judgement on defined scales instead. It’s quick, and good enough to set priorities, which is why it’s the most common method.
Each risk scenario gets a likelihood rating and an impact rating, and the two combine into a risk level.
The heat map
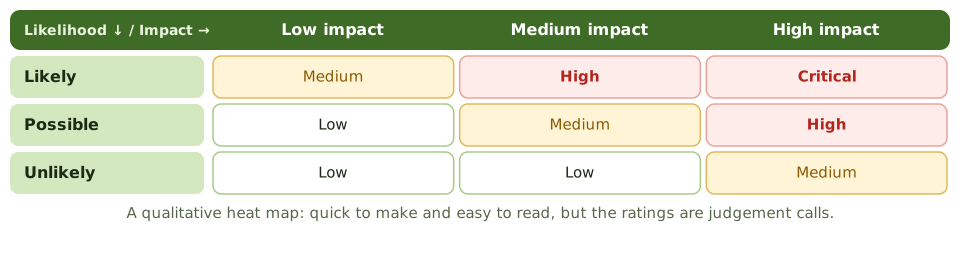
A heat map plots each risk by likelihood and impact. Executives see the risk profile at a glance: what’s in the red zone, and whether it’s moving over time.
Make the scales concrete
Vague words (“high impact”) mean different things to different people. Defined criteria make ratings consistent:
| Impact | Financial | Operations | Customers / legal |
|---|---|---|---|
| 1 Minor | Under 50,000 | Under 1 hour of disruption | No customer impact |
| 2 Moderate | 50,000 – 500,000 | Up to 1 day | A small group affected |
| 3 Major | 500,000 – 5 million | Up to 1 week | Regulator notified |
| 4 Severe | Over 5 million | Over 1 week | Large fine; national news |
Likelihood scales work the same way, for example “once in 10 years”, “once a year” and “monthly”. Ideally the scales match the enterprise risk method, so information risks compare with other business risks.
Strengths and weaknesses
| Strengths | Fast and cheap; easy to explain; works with limited data; engages business owners |
| Weaknesses | Subjective; inconsistent between assessors; hard to compare directly with control costs |
| Semi-quantitative | Numbers on the scales (1–5) help ranking, but 3 × 4 = 12 isn’t a money value |
| Making it reliable | Defined criteria, workshops with several viewpoints, calibration, peer review |
Example. In a workshop, the operations director rates “ransomware on warehouse systems” as Likely and Severe, using the agreed scale (over a week of disruption). It lands in the red zone and goes straight to the top of the treatment list.
How the exam asks about it
| If the question asks… | The answer is usually… |
|---|---|
| Main advantage of qualitative analysis | Quick and simple; works without hard data |
| Main disadvantage | Subjectivity |
| How to improve consistency | Defined criteria for each level of the scale |
| Numbers assigned to qualitative scales | Semi-quantitative analysis |
| Best tool to show the risk profile to executives | A heat map |
In short
- Qualitative analysis rates likelihood and impact on descriptive scales (such as low, medium, high) and combines them into a risk level.
- It's fast, easy to explain and works when hard data is scarce, so it's the most common method.
- Its weakness is subjectivity: different people rate the same risk differently.
- Defined scales with concrete descriptions (money, downtime, customers affected) make ratings consistent.
- Semi-quantitative analysis assigns numbers to the scales, helping ranking but not producing real money values.
- Heat maps show the risk profile at a glance and are good for communicating with executives.
Exam traps
- Qualitative isn't wrong or inferior; it's the normal choice when data is limited.
- Multiplying scale numbers (3 × 4 = 12) doesn't create a real money value.
- Ratings without defined criteria aren't comparable between assessors.
- A heat map communicates priority; it doesn't justify a specific spend amount by itself.
Slides
Click the slide and use the arrow keys. F toggles full screen.
The heat map