Topics in this domain
- Risk Management Concepts and Frameworks
- Inherent Risk, Residual Risk, Appetite and Tolerance
- Threat Actors, Motivations and Attack Vectors
- The Evolving Threat Landscape: AI, Cloud and Supply Chain
- Threat Modelling and Cyber Threat Intelligence
- Vulnerability Assessment and Scanning
- Control Deficiencies and Security Gap Analysis
- The Risk Assessment Process
- Qualitative Risk Analysis: Likelihood and Impact
- Quantitative Risk Analysis: SLE, ALE and Loss Estimation
- Risk Scenarios and Prioritisation
- Risk Treatment Options: Mitigate, Transfer, Avoid, Accept
- Risk Acceptance: Approval, Expiry and Review
- Cost-Benefit Analysis for Risk Treatment
- Risk Ownership vs Control Ownership
- RACI and Risk Escalation Paths
- The Risk Register
- Continuous Risk Monitoring and Key Risk Indicators
- Risk Reporting to Executives and the Board
- Integrating Risk Management into Business and IT Processes
Quantitative Risk Analysis: SLE, ALE and Loss Estimation
Putting a price on risk
Executives think in money. Quantitative analysis expresses risk as an expected loss, so it can be compared directly with the cost of controls, with insurance, and with other investments.
SLE and ALE
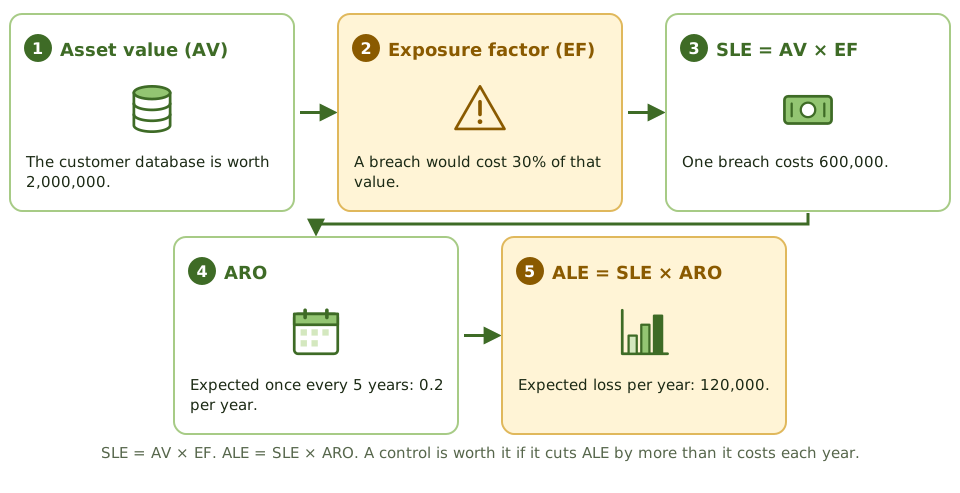
| Term | Meaning | Example |
|---|---|---|
| Asset value (AV) | What the asset is worth to the business | 2,000,000 |
| Exposure factor (EF) | Share of the value lost in one event | 30% |
| Single loss expectancy (SLE) | AV × EF: the cost of one occurrence | 600,000 |
| Annualised rate of occurrence (ARO) | Expected occurrences per year | 0.2 (once in 5 years) |
| Annualised loss expectancy (ALE) | SLE × ARO: expected loss per year | 120,000 |
Is the control worth it?
| Without control | With control | |
|---|---|---|
| SLE | 600,000 | 600,000 |
| ARO | 0.2 (once in 5 years) | 0.05 (once in 20 years) |
| ALE | 120,000 | 30,000 |
| Annual cost of control | – | 40,000 |
| Net annual benefit | – | 120,000 − 30,000 − 40,000 = 50,000 |
A control is cost-justified when it reduces ALE by more than it costs each year. Here it does, by 50,000.
Better estimates with FAIR
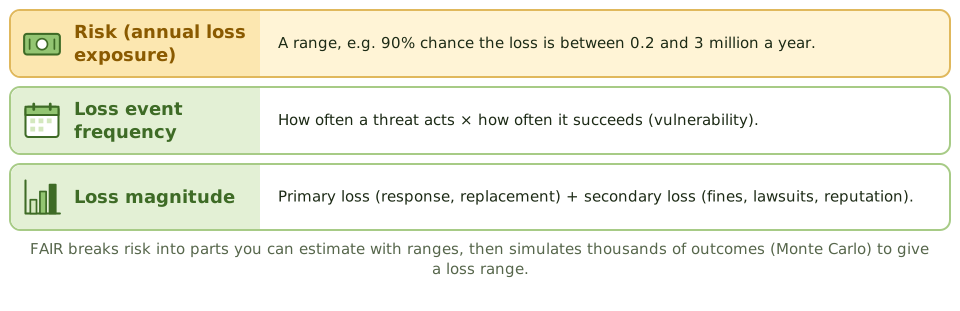
Single-number guesses for value and frequency look precise but often aren’t. FAIR (Factor Analysis of Information Risk) breaks risk into parts that are easier to estimate:
- Loss event frequency: how often a threat acts, and how often it succeeds.
- Loss magnitude: primary loss (response, replacement, lost productivity) and secondary loss (fines, lawsuits, reputational damage).
Each input is a range (minimum, most likely, maximum), and a Monte Carlo simulation produces a range of annual loss, for example “90% likely between 0.2 and 3 million”. That’s more honest, and more useful to the board, than a single figure.
Choosing a method
| Method | Best for |
|---|---|
| Qualitative | Triaging many risks quickly; limited data; communicating priorities |
| Quantitative | Big investment decisions, insurance decisions, boards that want money terms |
| Combined | Qualitative for the whole register, quantitative for the top few risks |
Data comes from incident history, insurance claims, industry loss studies and calibrated expert estimates.
How the exam asks about it
| If the question asks… | The answer is usually… |
|---|---|
| Formula for ALE | SLE × ARO |
| Formula for SLE | Asset value × exposure factor |
| Main advantage of quantitative analysis | Supports cost-benefit decisions |
| Main disadvantage | Reliable data is hard to obtain |
| When is a control cost-justified? | When the ALE reduction exceeds its annual cost |
In short
- Single loss expectancy (SLE) = asset value × exposure factor: the cost of one occurrence.
- Annualised loss expectancy (ALE) = SLE × annualised rate of occurrence (ARO): the expected loss per year.
- Quantitative analysis supports cost-benefit decisions: a control is justified when it reduces ALE by more than it costs each year.
- Its weakness is data: estimates of value, frequency and loss can be uncertain and look more precise than they are.
- FAIR models risk as loss event frequency and loss magnitude, using ranges and simulation instead of single guesses.
- Many organisations combine methods: qualitative to triage, quantitative for the biggest decisions.
Exam traps
- Exposure factor is the share of value lost in one event, not a probability.
- ARO is occurrences per year: once every 4 years is 0.25.
- Precise-looking figures built on guesses can mislead decision makers.
- Quantitative isn't always better; it's chosen when the decision justifies the effort and data exists.
Slides
Click the slide and use the arrow keys. F toggles full screen.
SLE and ALE
Better estimates with FAIR