Topics in this domain
- IT Risk Events, Loss Types and Business Outcomes
- Threat Sources, Actors and Motivations
- The Changing Threat Landscape and Threat Modelling
- Vulnerabilities, Control Deficiencies and Risk Conditions
- Identifying Internal and External Risk Factors
- Building IT Risk Scenarios
- Evaluating Scenarios for Completeness and Relevance
- Common Risk Scenario Errors
- Risk Assessment Concepts and Standards
- Qualitative, Semi-Quantitative and Quantitative Analysis
- Quantitative Methods: ALE, FAIR and Monte Carlo
- Risk Analysis Techniques: Bow-Tie, Fault Tree, Event Tree and Delphi
- Choosing a Consistent Assessment Methodology
- Translating Technical Events into Business Impact
- Business Impact Analysis for Risk Prioritisation
- Inherent and Residual Risk
- Evaluating Risk Against Business Objectives and Appetite
- Creating and Maintaining the IT Risk Register
- Using the Risk Register to Support Decisions
Qualitative, Semi-Quantitative and Quantitative Analysis
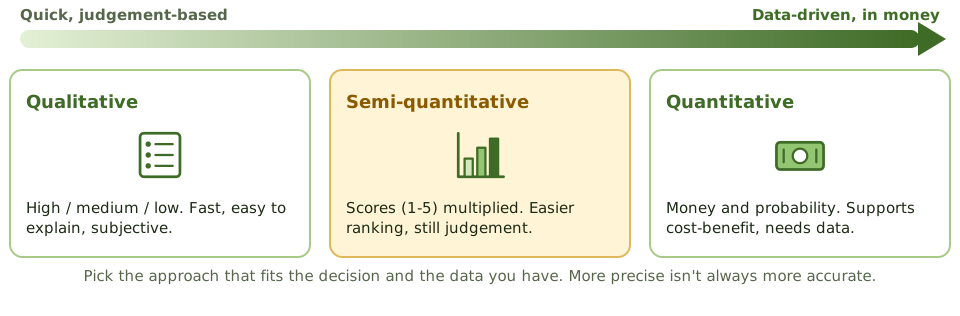
Three approaches
Strengths and weaknesses
| Approach | Strength | Weakness |
|---|---|---|
| Qualitative | Fast, easy to explain, no data needed | Subjective; hard to compare with costs |
| Semi-quantitative | Easier ranking and aggregation | Scores look precise but aren’t |
| Quantitative | Money terms; supports cost-benefit | Needs data; time-consuming |
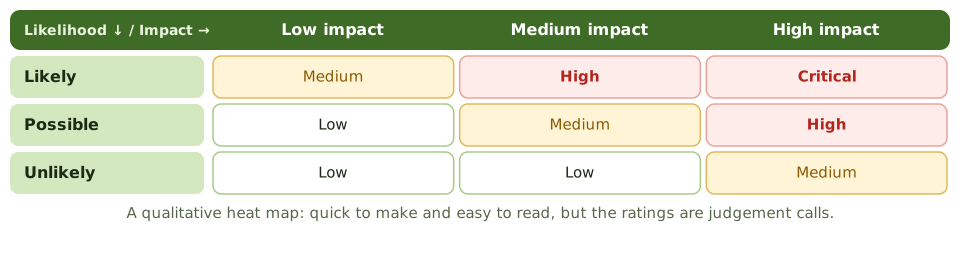
The heat map
Choosing an approach
- What decision will the result support?
- Is reliable loss and frequency data available?
- How much time and expertise do we have?
- Does it fit the enterprise risk method?
Example. A small firm with no incident data uses a qualitative heat map to prioritise its top 20 risks in two weeks. For its single largest investment, a new data centre, it builds a quantitative model with ranges.
How the exam asks about it
| If the question asks… | The answer is usually… |
|---|---|
| Advantage of qualitative analysis | Quick, needs little data |
| Advantage of quantitative analysis | Supports cost-benefit in money |
| Main weakness of quantitative analysis | Depends on reliable data |
| MOST important when choosing | Fit with the decision and the data, applied consistently |
In short
- Qualitative analysis uses descriptive scales such as high, medium and low; it's fast but subjective.
- Semi-quantitative analysis assigns numbers to scales and combines them; it ranks more easily but is still judgement-based.
- Quantitative analysis uses money and probabilities; it supports cost-benefit decisions but needs reliable data.
- Choose the approach that fits the decision and the data available, and apply it consistently.
- Precise-looking numbers based on weak data can mislead.
Exam traps
- Assuming quantitative analysis is always more accurate.
- Treating semi-quantitative scores as if they were real measurements.
- Mixing approaches so that ratings can't be compared.
- Using qualitative ratings to justify detailed investment cases.
Slides
Click the slide and use the arrow keys. F toggles full screen.
Three approaches
The heat map
1 / 8