Topics in this domain
- IT Risk Events, Loss Types and Business Outcomes
- Threat Sources, Actors and Motivations
- The Changing Threat Landscape and Threat Modelling
- Vulnerabilities, Control Deficiencies and Risk Conditions
- Identifying Internal and External Risk Factors
- Building IT Risk Scenarios
- Evaluating Scenarios for Completeness and Relevance
- Common Risk Scenario Errors
- Risk Assessment Concepts and Standards
- Qualitative, Semi-Quantitative and Quantitative Analysis
- Quantitative Methods: ALE, FAIR and Monte Carlo
- Risk Analysis Techniques: Bow-Tie, Fault Tree, Event Tree and Delphi
- Choosing a Consistent Assessment Methodology
- Translating Technical Events into Business Impact
- Business Impact Analysis for Risk Prioritisation
- Inherent and Residual Risk
- Evaluating Risk Against Business Objectives and Appetite
- Creating and Maintaining the IT Risk Register
- Using the Risk Register to Support Decisions
Quantitative Methods: ALE, FAIR and Monte Carlo
The classic formulas
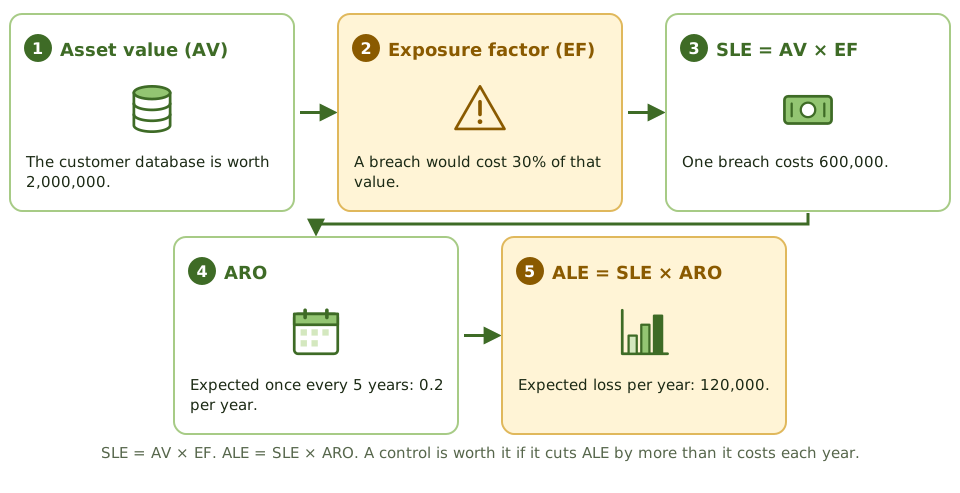
- Single loss expectancy (SLE) = asset value × exposure factor.
- Annualised loss expectancy (ALE) = SLE × annualised rate of occurrence (ARO).
Is the control worth it?
| Item | Value |
|---|---|
| ALE before control | 120,000 |
| ALE after control | 30,000 |
| Reduction in ALE | 90,000 |
| Annual cost of control | 40,000 |
| Net benefit | 50,000 a year: justified |
Compare the control’s cost with the reduction in ALE, not with total ALE.
FAIR
Monte Carlo
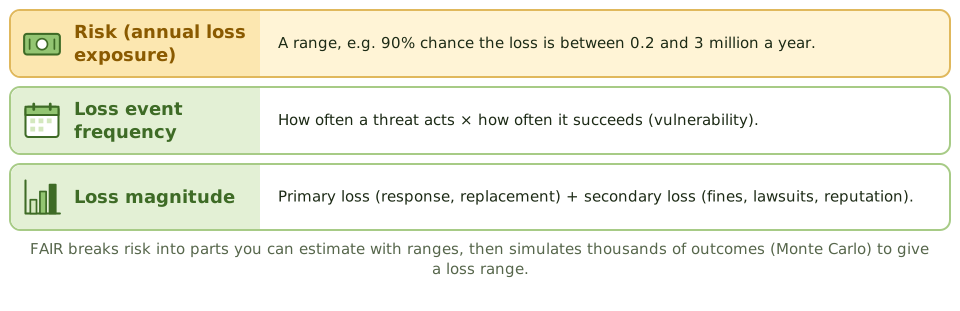
Instead of single guesses, estimators give ranges: “between two and six events a year, each costing 50,000 to 400,000”. Monte Carlo simulation runs thousands of random combinations to show the range of likely annual losses and their probabilities.
Example. A FAIR analysis shows a 90% chance that annual losses from ransomware fall between 0.3 and 2.5 million. The board compares this with an insurance quote and a backup upgrade.
How the exam asks about it
| If the question asks… | The answer is usually… |
|---|---|
| ALE formula | SLE × ARO |
| When a control is justified | The ALE reduction exceeds its annual cost |
| FAIR’s two main factors | Loss event frequency and loss magnitude |
| Purpose of Monte Carlo simulation | Produce a range of outcomes with probabilities |
In short
- SLE = asset value × exposure factor; ALE = SLE × annualised rate of occurrence.
- A control is financially justified when it reduces ALE by more than its annual cost.
- FAIR breaks risk into loss event frequency and loss magnitude, estimated as ranges.
- Monte Carlo simulation turns ranges into a distribution of possible annual losses.
- Quantitative results are only as good as their input data and assumptions.
Exam traps
- Confusing SLE with ALE.
- Comparing a control's cost with total ALE instead of the reduction in ALE.
- Presenting a single precise number when inputs are uncertain.
- Using quantitative methods with no data to support the inputs.
Slides
Click the slide and use the arrow keys. F toggles full screen.
The classic formulas
FAIR
1 / 8