Topics in this domain
- IT Risk Events, Loss Types and Business Outcomes
- Threat Sources, Actors and Motivations
- The Changing Threat Landscape and Threat Modelling
- Risk Identification Techniques
- Vulnerabilities, Control Deficiencies and Risk Conditions
- Identifying Internal and External Risk Factors
- Root Cause Analysis for Risk Events and Control Failures
- Building IT Risk Scenarios
- Evaluating Scenarios for Completeness and Relevance
- Common Risk Scenario Errors
- Risk Assessment Concepts and Standards
- Qualitative, Semi-Quantitative and Quantitative Analysis
- Quantitative Methods: ALE, FAIR and Monte Carlo
- Risk Analysis Techniques: Bow-Tie, Fault Tree, Event Tree and Delphi
- Choosing a Consistent Assessment Methodology
- Translating Technical Events into Business Impact
- Business Impact Analysis for Risk Prioritisation
- Inherent and Residual Risk
- Evaluating Risk Against Business Objectives and Appetite
- Creating and Maintaining the IT Risk Register
- Using the Risk Register to Support Decisions
Root Cause Analysis for Risk Events and Control Failures
Symptoms come back
If you fix only what people noticed, the same event happens again next month. Root cause analysis (RCA) keeps asking why until it reaches something that, once fixed, stops the event for good.
Example. Three times in a year, a payment run fails after a weekend change. Each time, IT rolls back the change. Nobody asks why untested changes keep reaching production.
For a risk practitioner, RCA matters in two places: after risk events (incidents, losses, near misses) and after control failures found in testing or audit.
From symptom to root cause
Events have layers of cause, and stopping at the first layer is the most common mistake. The diagram uses a failed payment run to show four levels, from what people noticed down to the underlying gap.
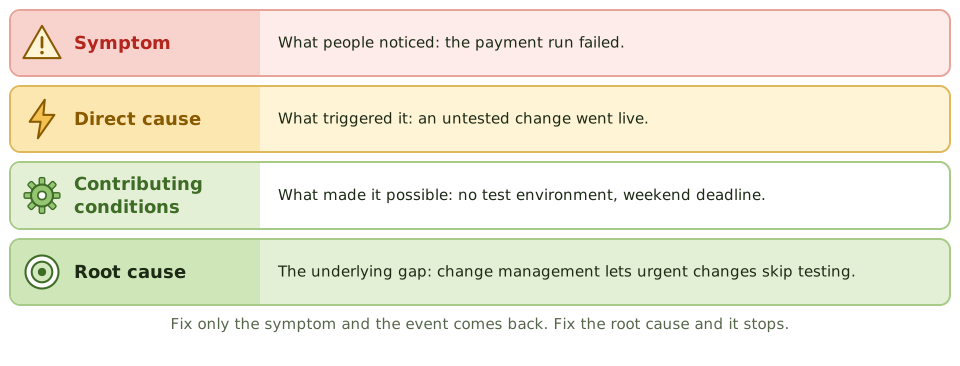
| Level | Question | Example |
|---|---|---|
| Symptom | What did we see? | The payment run failed |
| Direct cause | What triggered it? | An untested change went live |
| Contributing conditions | What made it possible or worse? | No test environment; weekend deadline |
| Root cause | What underlying gap allowed it? | Change management lets urgent changes skip testing |
The five whys
The five whys is the simplest RCA technique. The diagram follows one example: transfers to a partner failed, because the partner rejected the connection, because a certificate had expired, because nobody knew it was expiring, because there was no expiry monitoring. The permanent fix is monitoring certificate expiry across all integrations, not just renewing one certificate.
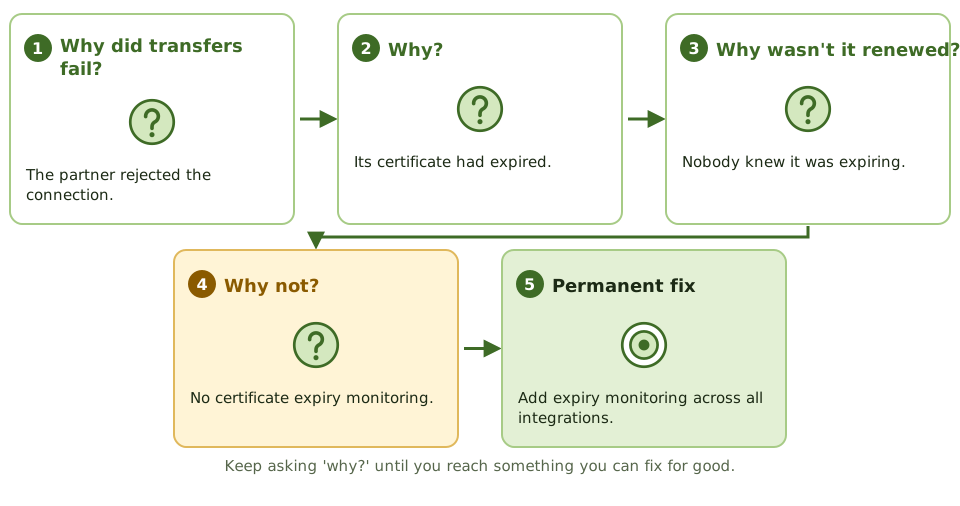
Keep asking “why?” until the answer is something you can fix permanently. Five is a rule of thumb, not a rule.
Looking in every direction
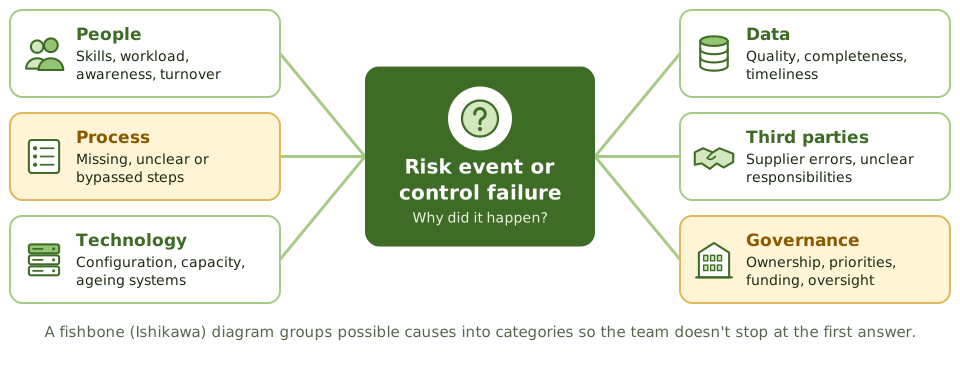
The five whys follows one line of reasoning. A fishbone (Ishikawa) diagram makes the team consider several categories of cause, so it doesn’t stop at the first plausible answer. Fault tree analysis works backwards from an event through the combinations of failures that could cause it (see the analysis techniques article).
After the analysis
- Fix the root cause, not just the example found.
- Update the risk scenario, the likelihood estimate and the control design.
- Look for the same cause elsewhere in the organisation.
- Check later that the fix worked and the event hasn’t recurred.
“Human error” is rarely a root cause. Ask what made the error possible and why no control caught it. RCA that is used to blame people teaches everyone to hide problems.
How the exam asks about it
| If the question asks… | The answer is usually… |
|---|---|
| The same incident keeps happening | Root cause analysis; problem management |
| FIRST step after a control failure | Find out why it failed |
| Root cause given as “human error” | Dig deeper: process, training, design |
| Purpose of RCA | Prevent recurrence by fixing causes |
| What RCA results should update | Risk register, scenarios and controls |
In short
- Root cause analysis (RCA) finds the underlying reason an event or control failure happened, so it can be prevented.
- Separate the symptom, the direct cause, contributing conditions and the root cause.
- Common methods: the five whys, fishbone (Ishikawa) diagrams, and fault tree analysis.
- Root causes are usually in process, governance or ownership, not a single person's mistake.
- RCA results should update the risk register, scenarios and control design.
Exam traps
- Stopping at the first answer, usually 'human error'.
- Fixing the one example found instead of the process that allowed it.
- Using RCA to find someone to blame, which makes people hide problems.
- Doing RCA but never checking the fix worked.
Slides
Click the slide and use the arrow keys. F toggles full screen.
Turn your phone sideways for a bigger view. Tap any diagram to enlarge it.
From symptom to root cause
The five whys
Looking in every direction